Dashboard
On the Dashboard, you can view the graphics and charts of cases distribution, cases trend, patient change trend and other data in institution in real time.
Note
If a user is an ordinary member, only the graphics and charts belong to the user of certain institution can be viewed.
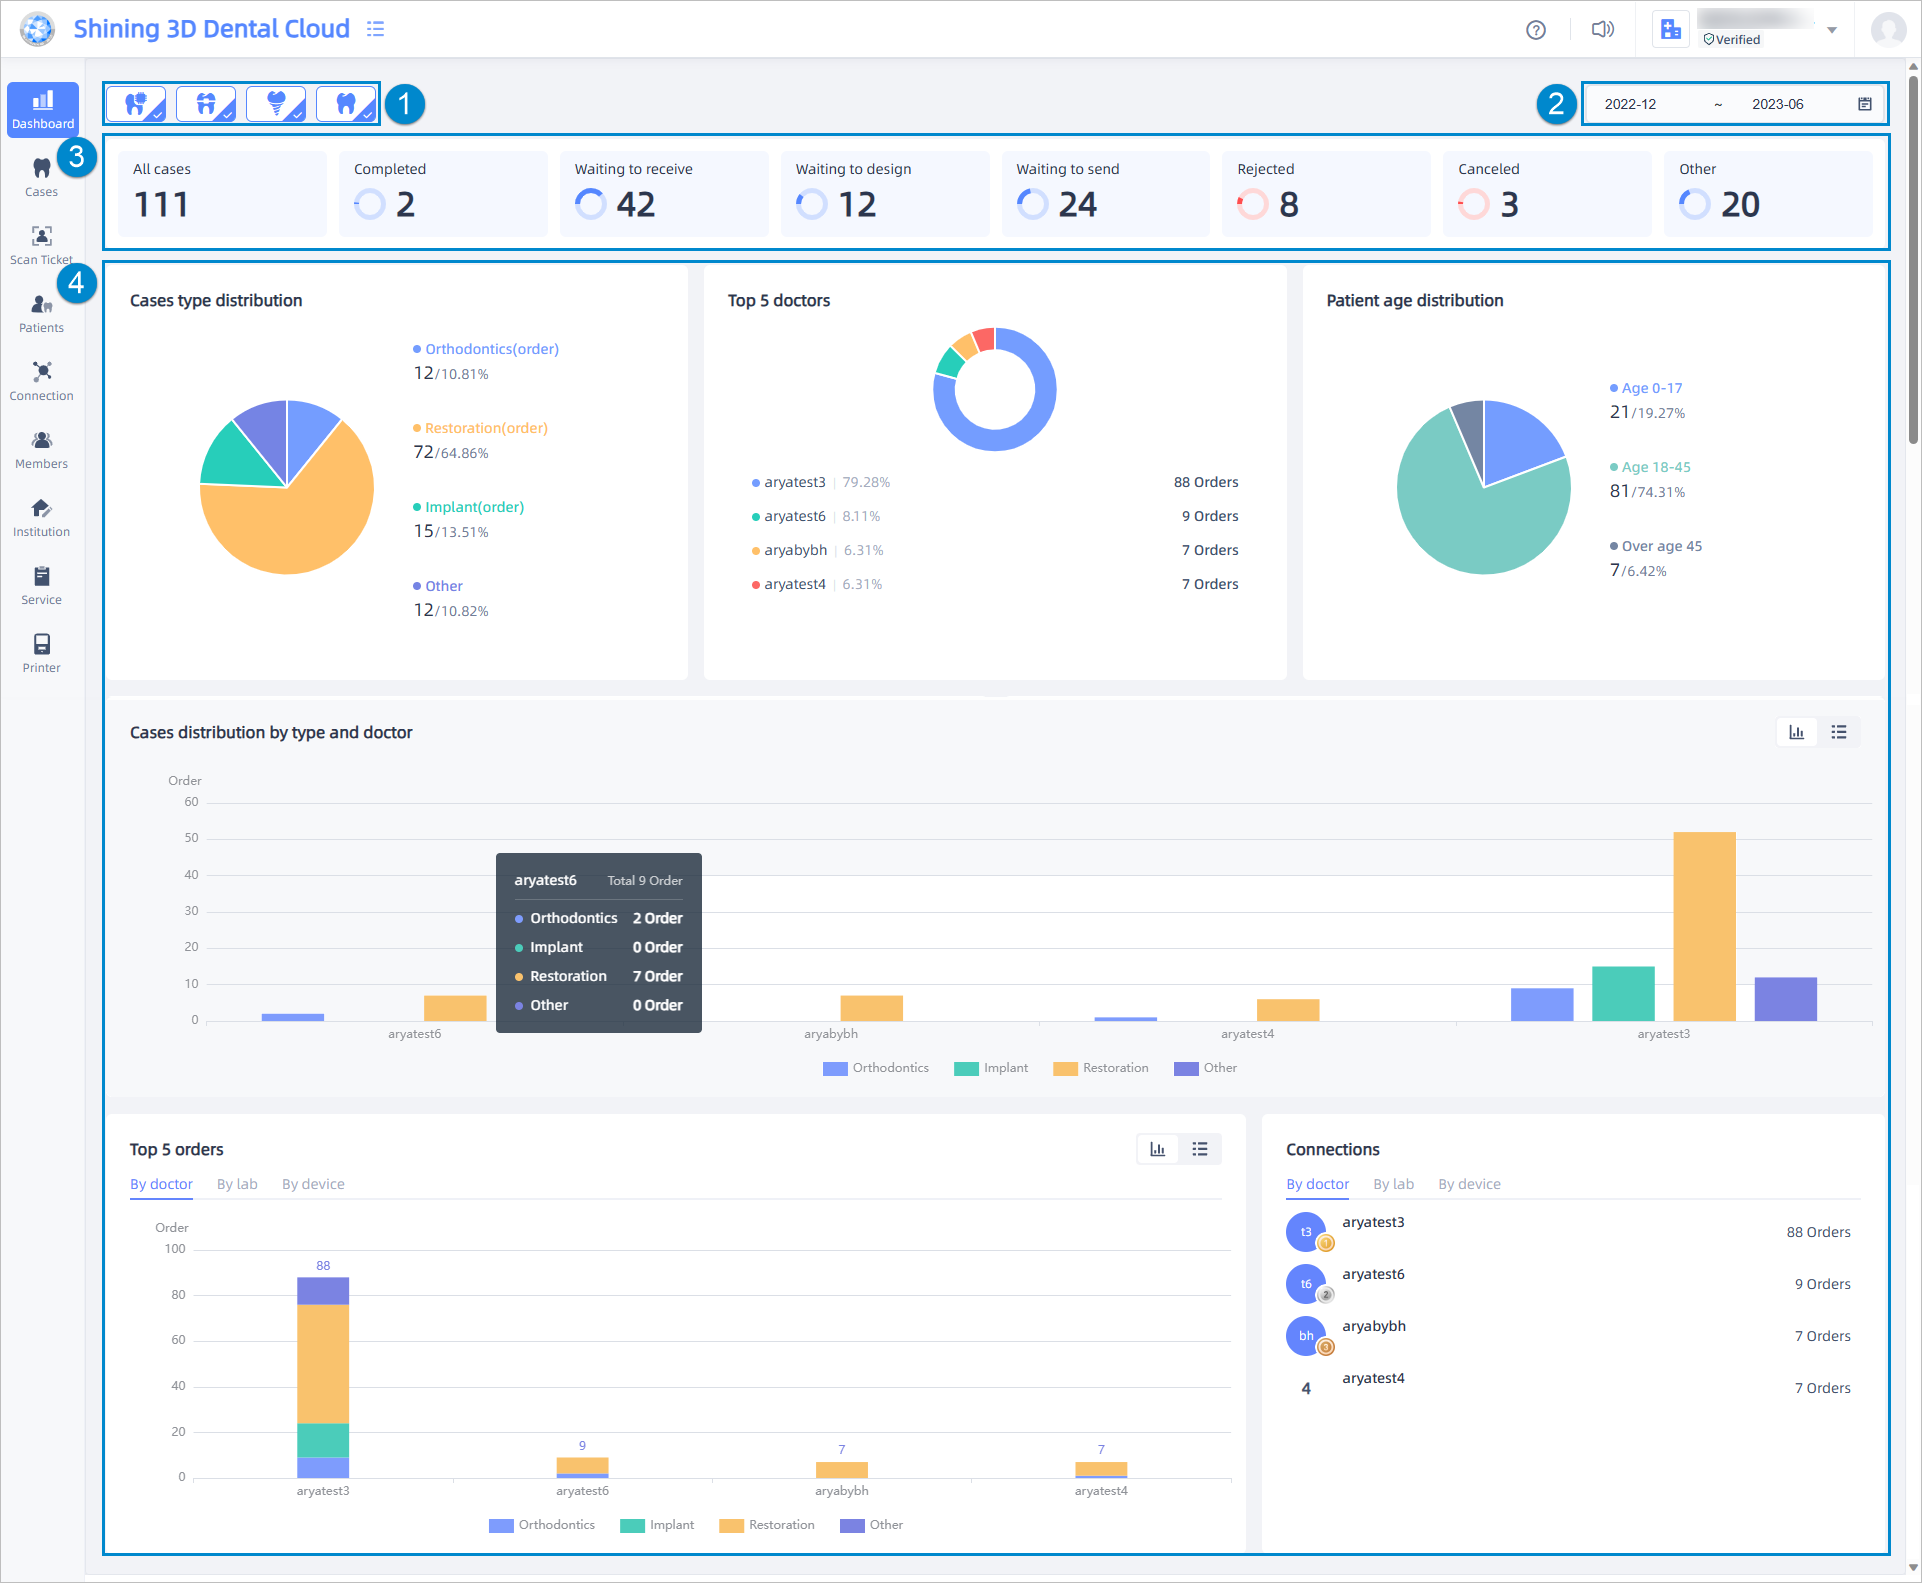
①: Display different data in dashboard by ticking the case type. By default, all case types (restoration, orthodontics, implant, and others) are selected. Deselecting a case type will hide its case data.
②: Display different data in dashboard by setting a time range. Cases from the past 6 months is displayed by default. Click the shortcut button to display the cases from the past 1 month, 3 months and 6 months.
③: Display the status of the selected cases. Hover over a status box shows the cases percentage for that status.
④: Display cases type distribution, top 5 doctors, patient age distribution, case distribution by time, the age distribution of patients from each doctor, cases distribution by type and doctor, top 5 orders and connection.
Note
Some types of data can be displayed through graphics and charts or lists:
![]() : Display data by graphics and charts.
: Display data by graphics and charts.
![]() : Display data by lists.
: Display data by lists.