Dashboard
On the Dashboard, you can view real-time graphics and charts of your institution's cases distribution, orders distribution, devices&clinics number trends, device details and other data. And based on those real-time data, the platform provides Order Analysis, Clinic Order Analysis and Device Order Analysis, and supports exporting designated data report.
Besides, the platform can analyze those data to provide Note (namely business precaution), as well as send monthly reports on order and device data to your email.
Note
Only users in the role of administrator can check the data on the dashboard.
Overview
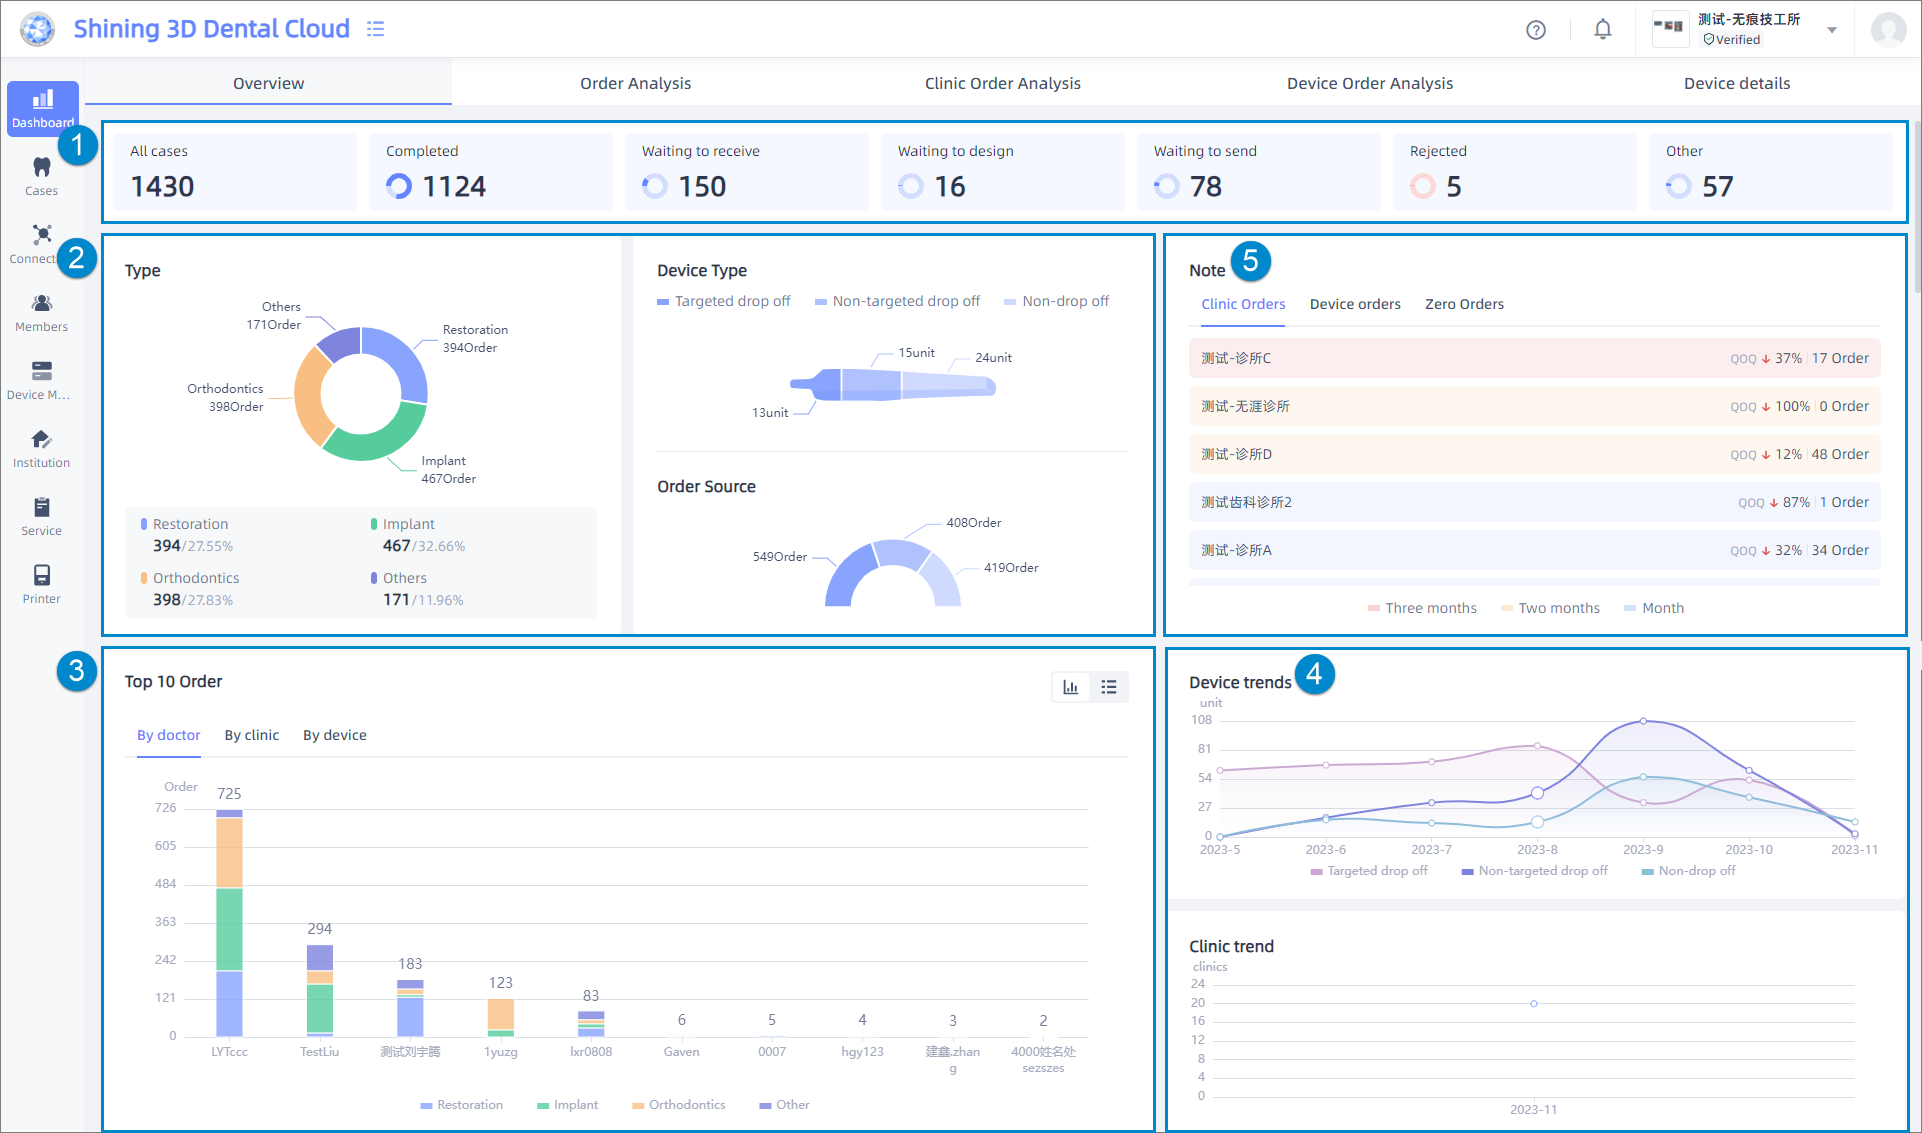
① All cases: Display the distribution of order statuses (completed, waiting to receive, waiting to design, waiting to send, etc.) in the current lab.
When the cursor hovers over a certain status, the percentage for orders of that corresponding status will be displayed.
② Type&Device Type&Order Source: display the distribution of order types (restoration, orthodontics, implant, etc.), device type (targeted drop off, non-targeted drop off and non-drop off) and order source in terms of all accepted orders in the current lab.
When the cursor hovers over a certain type, the percentage for devices of that corresponding type will be displayed.
Note
The introduction to three device types is as follows:
- Targeted drop off: The bounded devices purchased by the current lab and delivered to a specific clinic, who can only send orders to the current lab through the device.
- Non-targeted drop off: The unbounded devices purchased by the current lab and delivered to one clinic, who can send orders to any lab through the device.
- Non-drop off: The devices that are not purchased by the current lab.
③ TOP 10 Order: Display the ranking of orders in the current lab using a bar chart. You can choose to display it by doctor, by clinic or by device.
When hovering over a bar, it will show the total number of orders and the quantity of different types of orders respectively (all types of orders are displayed by default). You can select or deselect the legend corresponding to order types to choose which types of orders to display.
You can choose to display the data in either chart or list format using chart-column ![]() for the chart view and chart
for the chart view and chart ![]() for the list view.
for the list view.
④ Device Trends&Clinic Trend: Display the trend of device in the current lab (number of devices that have sent orders) and the trend of the number of connected clinics using a line graph. The device trend will show the data for the past 6 months by default.
When hovering over a specific time point, it will display the total number of devices and the quantity of different device types respectively (all device types are displayed by default). You can select or deselect the legend corresponding to device types to choose which types of devices to display.
You can hover over the chart and use the mouse scroll wheel to view more data.
⑤ Note:
Clinic Orders, Device Orders: Track the business of orders that have declined by more than 10% in a single month, consecutive two months, and consecutive three months, and display the corresponding QOQ change and the number of orders.
Zero Orders: Track the number of drop-off devices and connected clinics with zero orders in a single month, consecutive two months, and consecutive three months respectively.
Order Analysis
The platform provides order analysis, clinic order analysis, and device order analysis based on the analysis results, displayed through line graphs.
The data is shown for the latest month on a daily basis, and the manual switching to monthly display (showing data for the latest year by default) and customizing the time range using the calendar-days ![]() are also supported.
are also supported.
You can click export ![]() to export the data report (XLSX) for a specific module.
to export the data report (XLSX) for a specific module.
The default display mode is Trend, which can be switched to QOQ or YOY data.
You can choose to display the data in either chart or list format using the chart-column ![]() for the chart view and chart
for the chart view and chart ![]() for the list view.
for the list view.
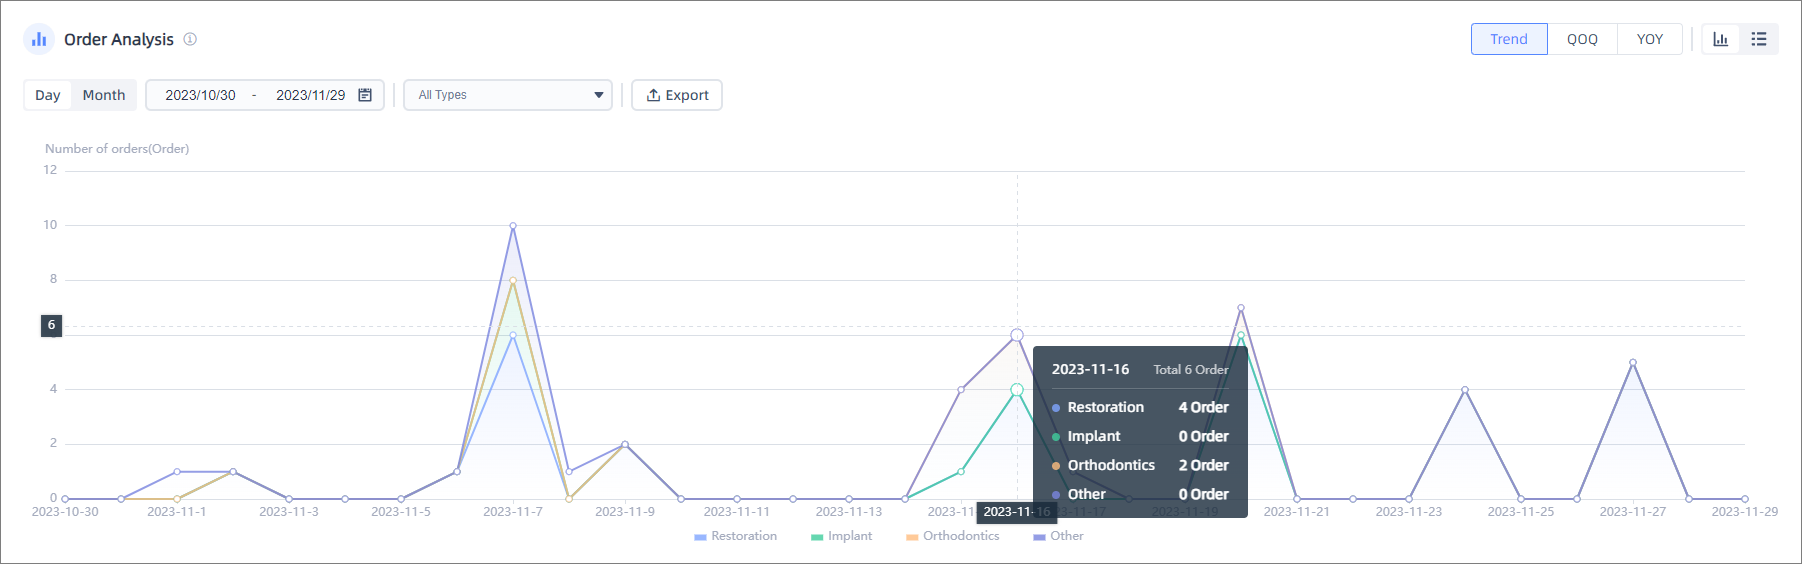
All Types of orders are displayed by default, and you can use the checkboxes in the dropdown list to select the types of orders to be displayed, which can also be achieved by selecting or deselecting the legends corresponding to the order types.
Hovering the cursor over a specific time point will display the total number of orders for that period and the quantity of different types of orders within it.
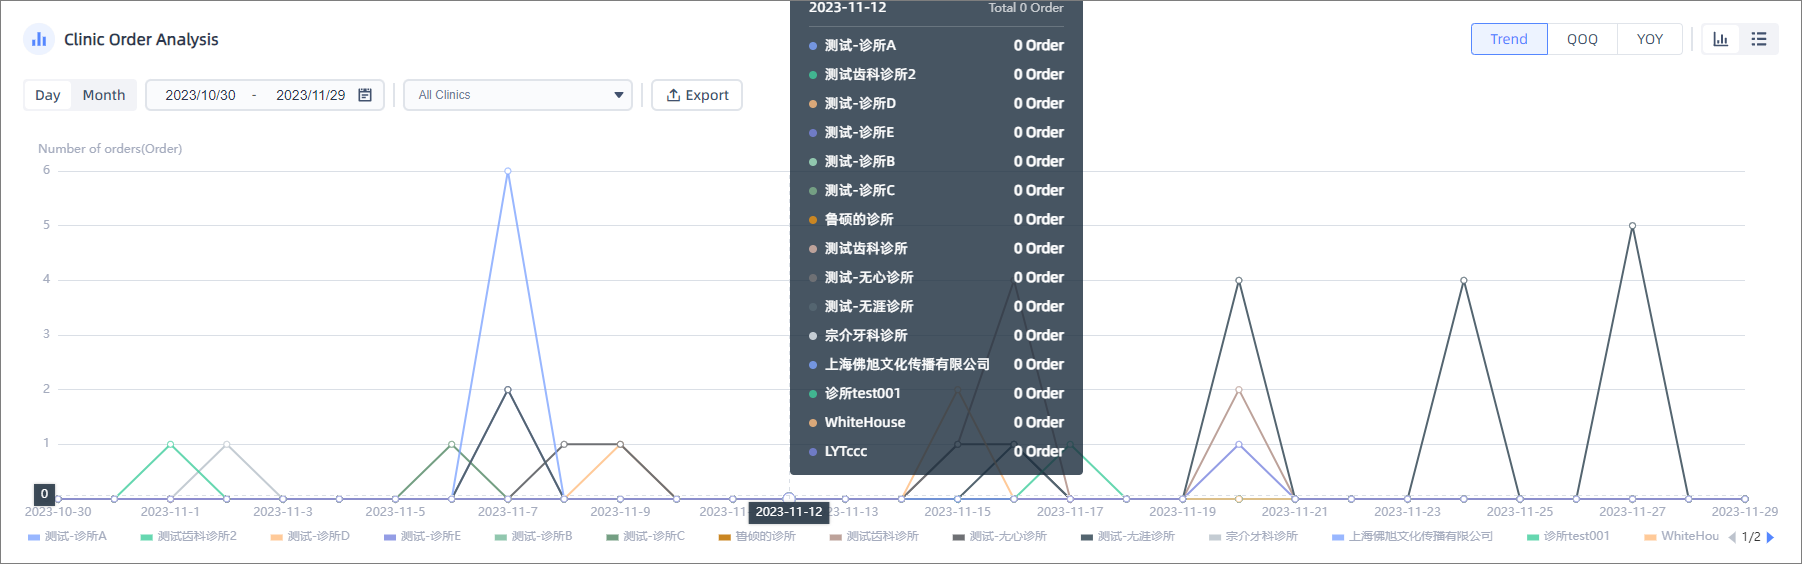
All Clinics of orders are displayed by default, and you can use the checkboxes in the dropdown list to select the clinics to be displayed, which can also be achieved by selecting or deselecting the legends corresponding to the clinics.
Hovering the cursor over a specific time point will display the total number of orders for that period and the quantity of orders sent from different clinics within it.
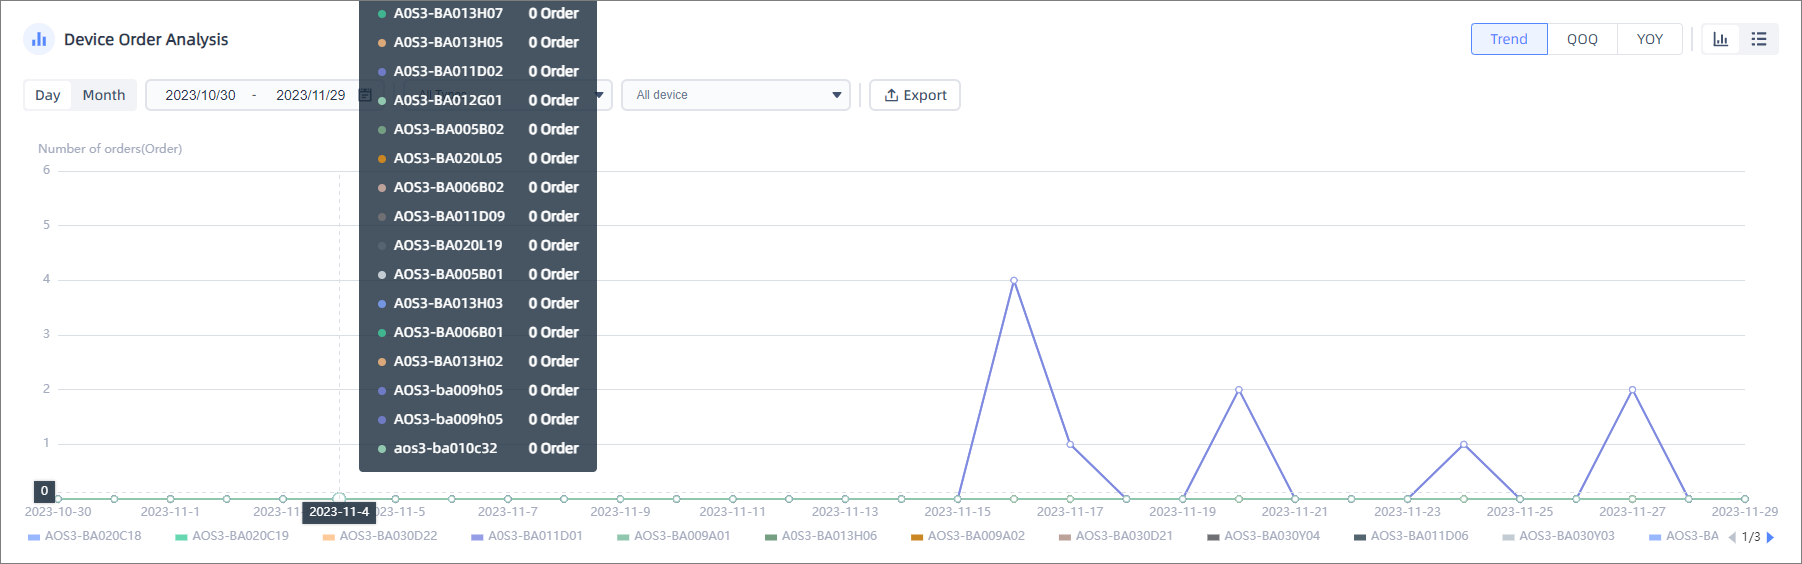
All Types of orders are displayed by default, and you can use the checkboxes in the dropdown list to select to display targeted drop off or non-target drop off; All Devices are displayed by default the clinics to be displayed, and you can use the checkboxes in the dropdown list to select devices to be displayed, which can also be achieved by selecting or deselecting the legends corresponding to the devices.
Hovering the cursor over a specific time point will display the total number of orders for that period and the quantity of orders sent through different devices within it.
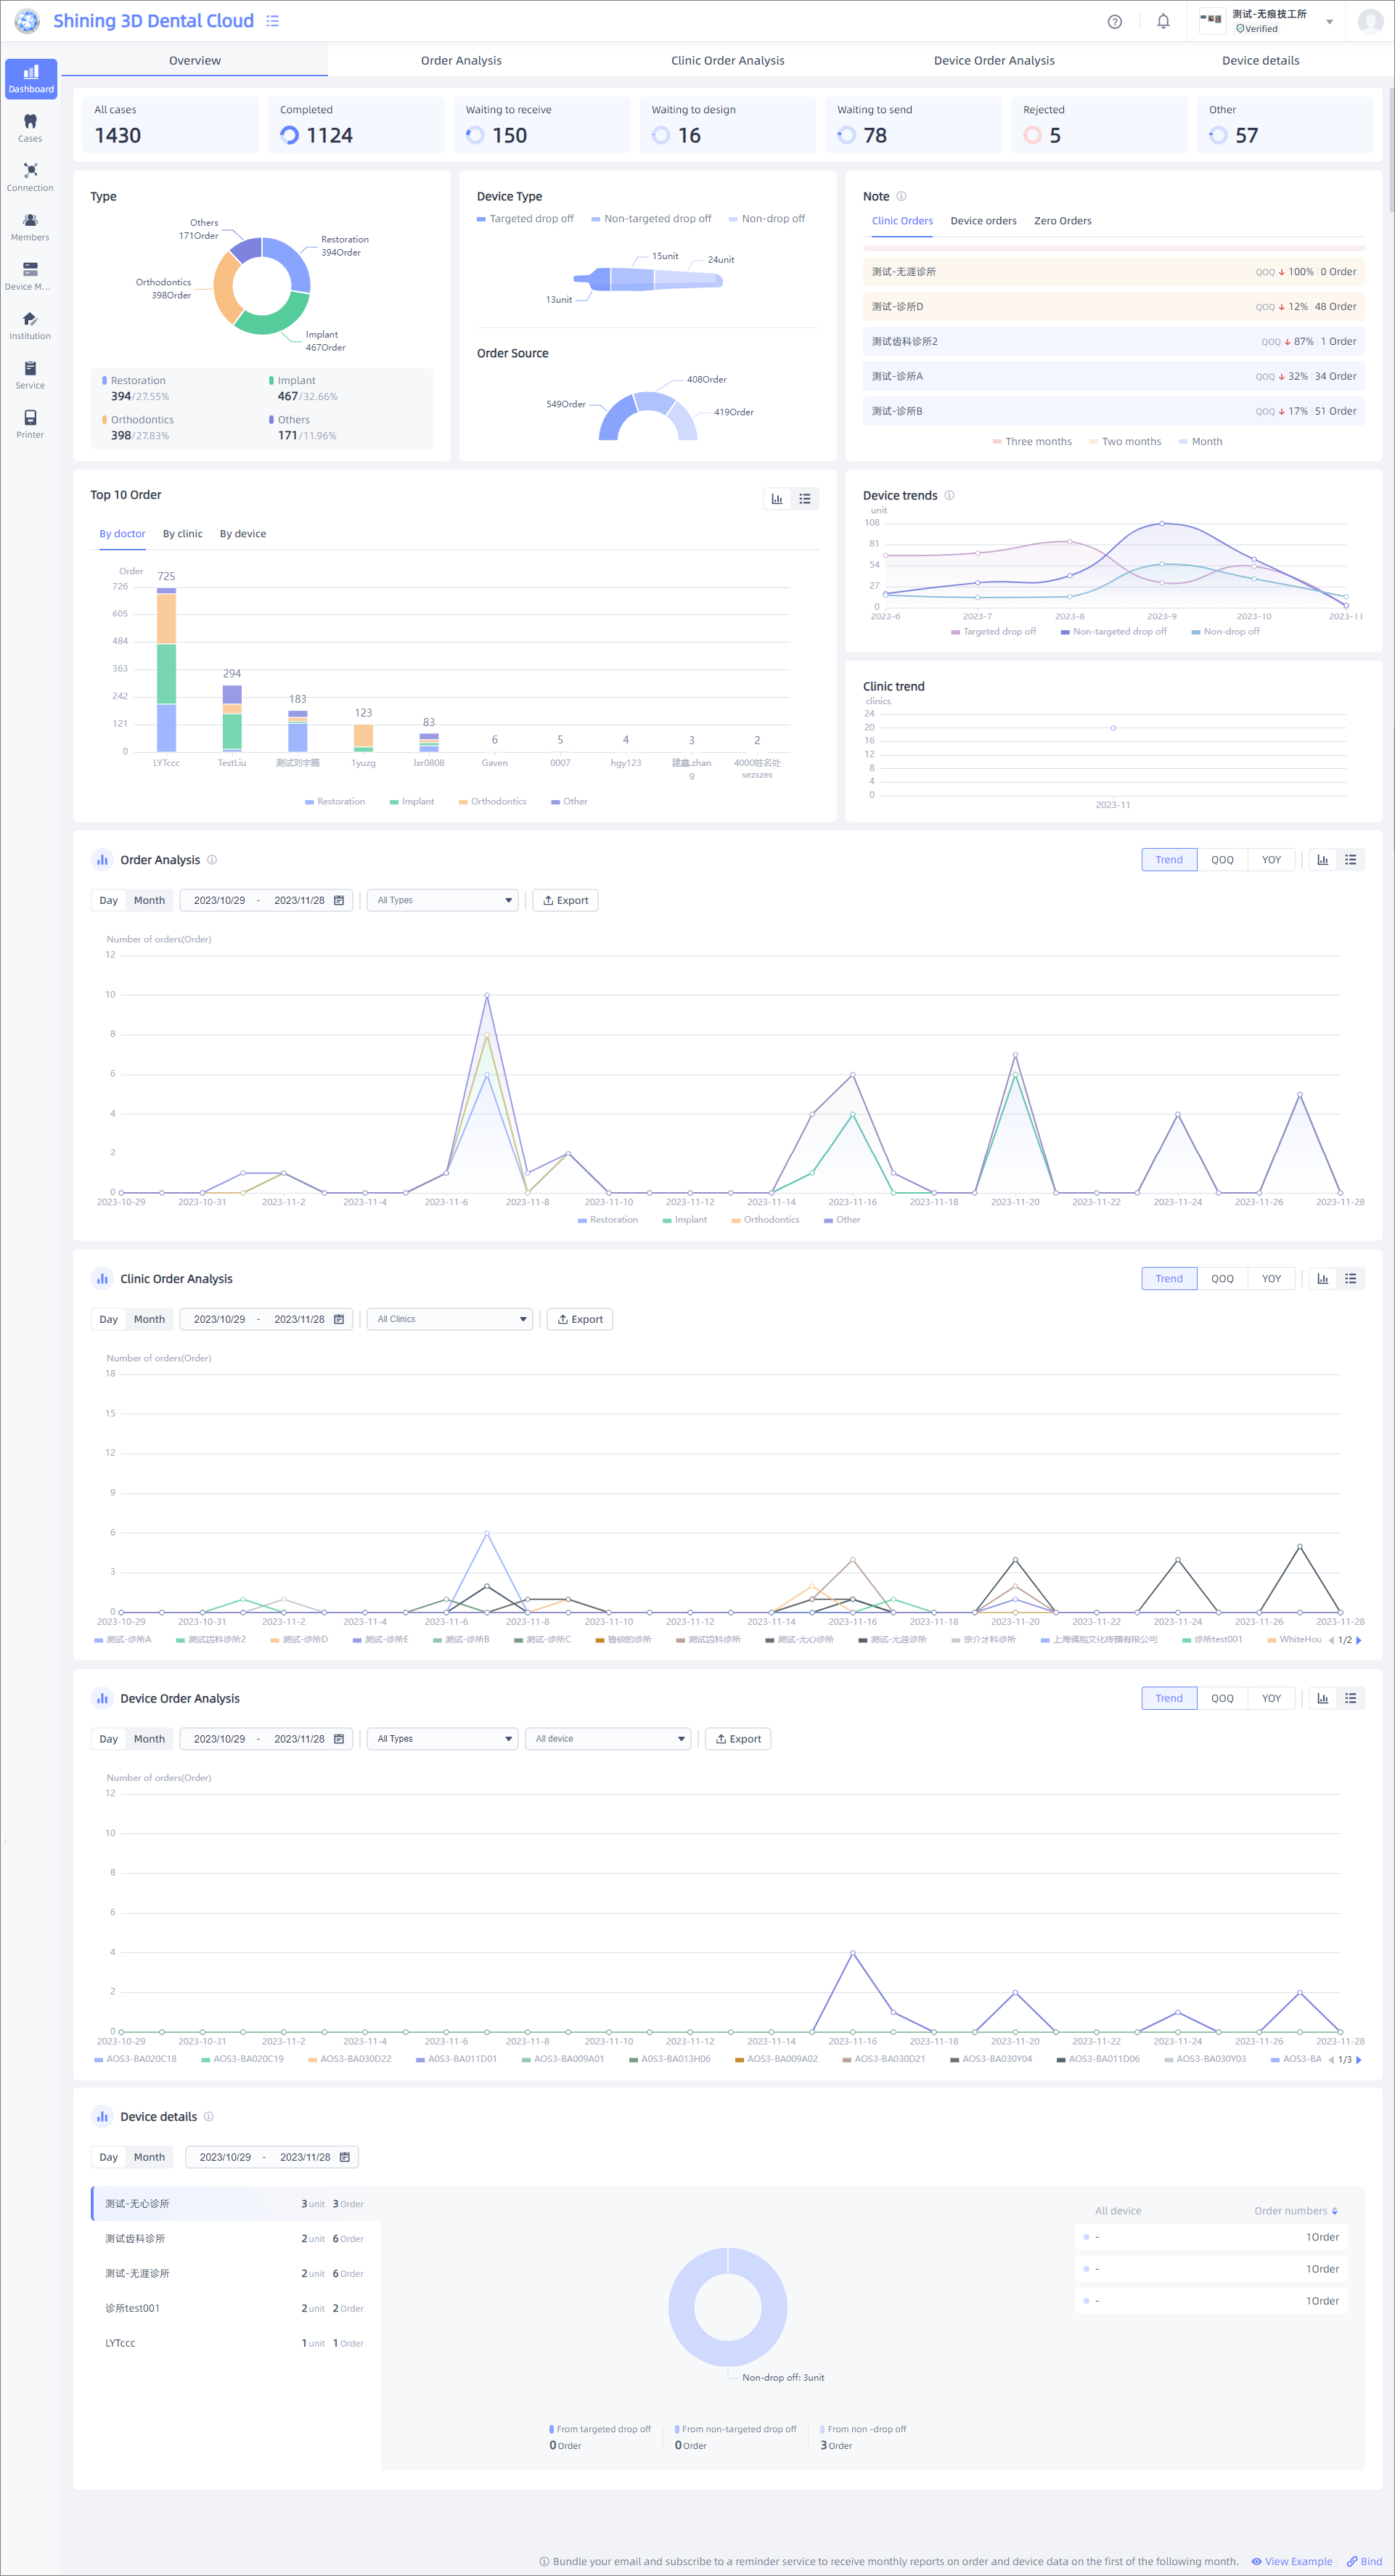
Device Details
Display all devices of the current lab using a pie chart, including the number of devices and orders.
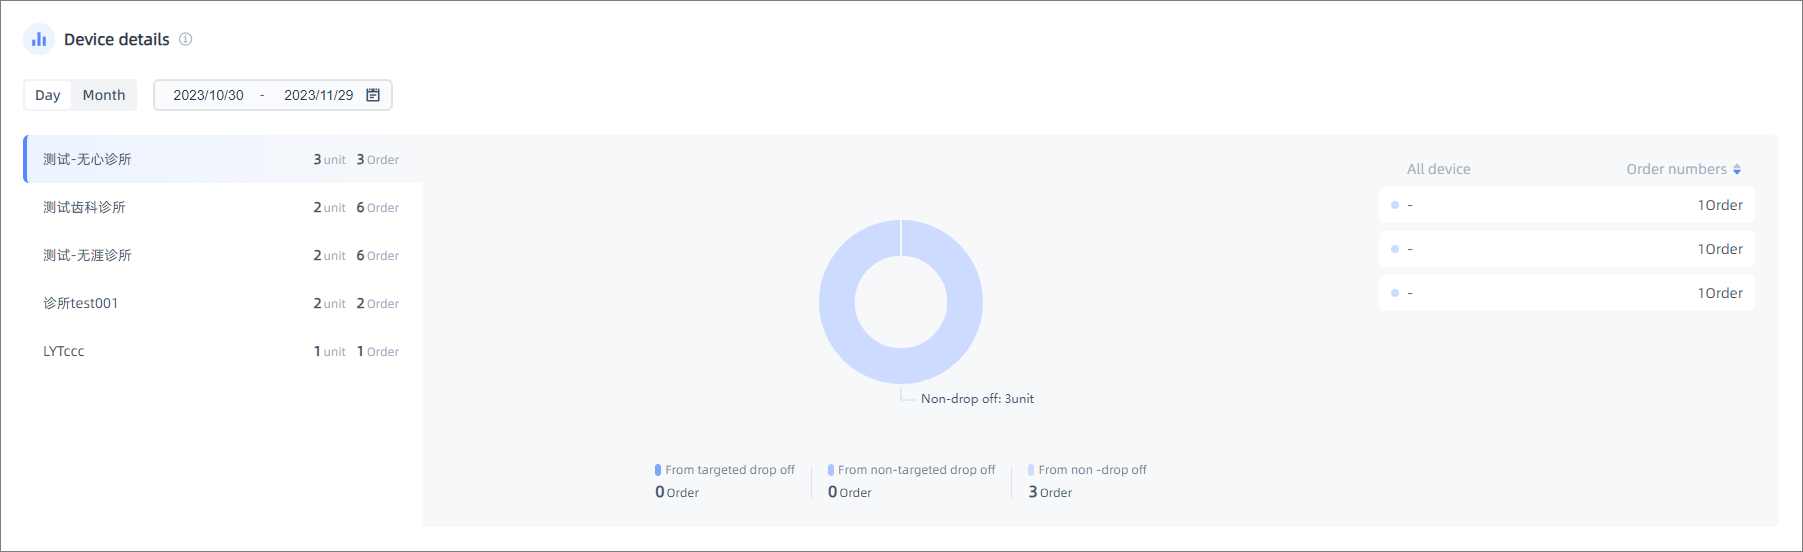
The data is shown for the latest month on a daily basis, and the manual switching to monthly display (showing data for the latest year by default) and customizing the time range using the calendar-days ![]() are also supported.
are also supported.
The pie chart displays the device deployment status of the first clinic in the left-hand list by default, and you can switch clinics to change the data displayed in the pie chart and the corresponding device list on the right-hand side.
Note
The serial number of non-target drop off devices will not be displayed.
Monthly Report
Click the ![]() Bind button, or click
Bind button, or click ![]() account on the top navigation bar >
account on the top navigation bar > ![]() Change password, to bind Email and subscribe to a reminder service monthly reports on order and device data on the first of the following month.
Change password, to bind Email and subscribe to a reminder service monthly reports on order and device data on the first of the following month.
Note
Only users in the role of administrator can subscribe to the reminder service.
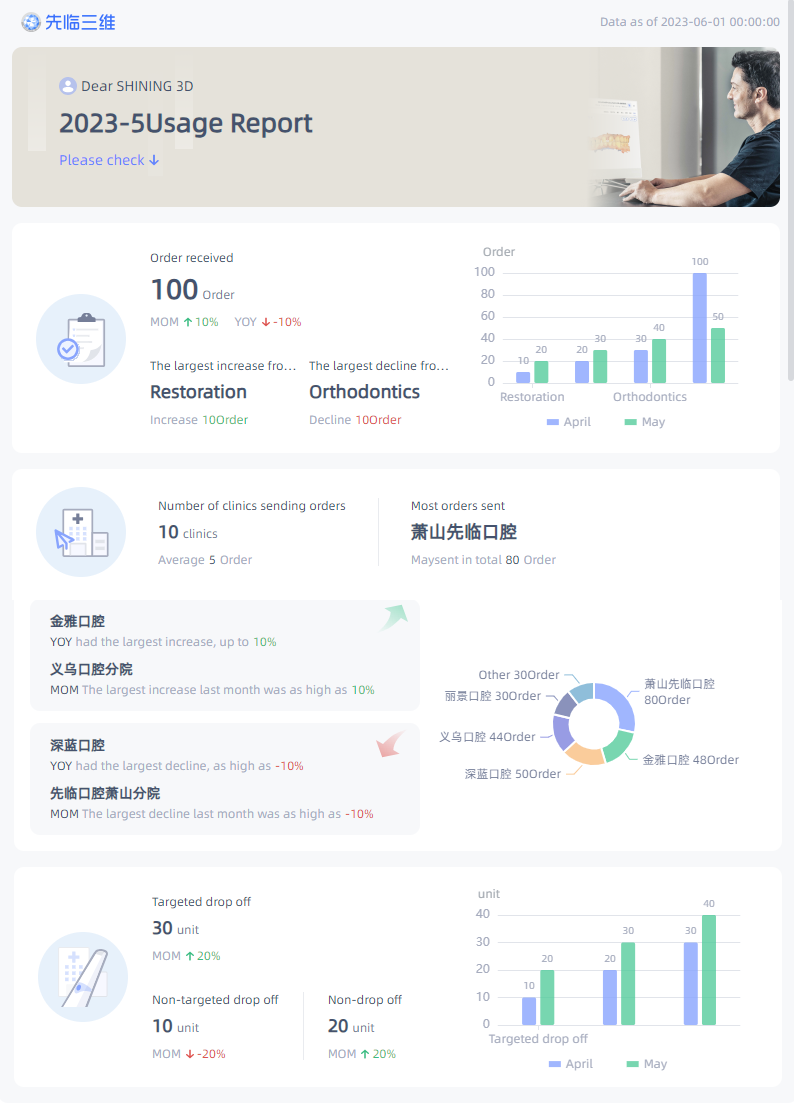
The monthly report will include the analysis to order received, number of clinics sending orders and number of different types of devices.
The example of monthly report is shown as follows: