Model comparison
Model Comparison is a tool that can compare and analyze the difference of a patient's intraoral data at different times. It can monitor multiple sets of tooth position changes and intraoral tooth wear data for orthodontic treatment.
Click to enter model comparison interface.
| No. | Name | Description |
|---|---|---|
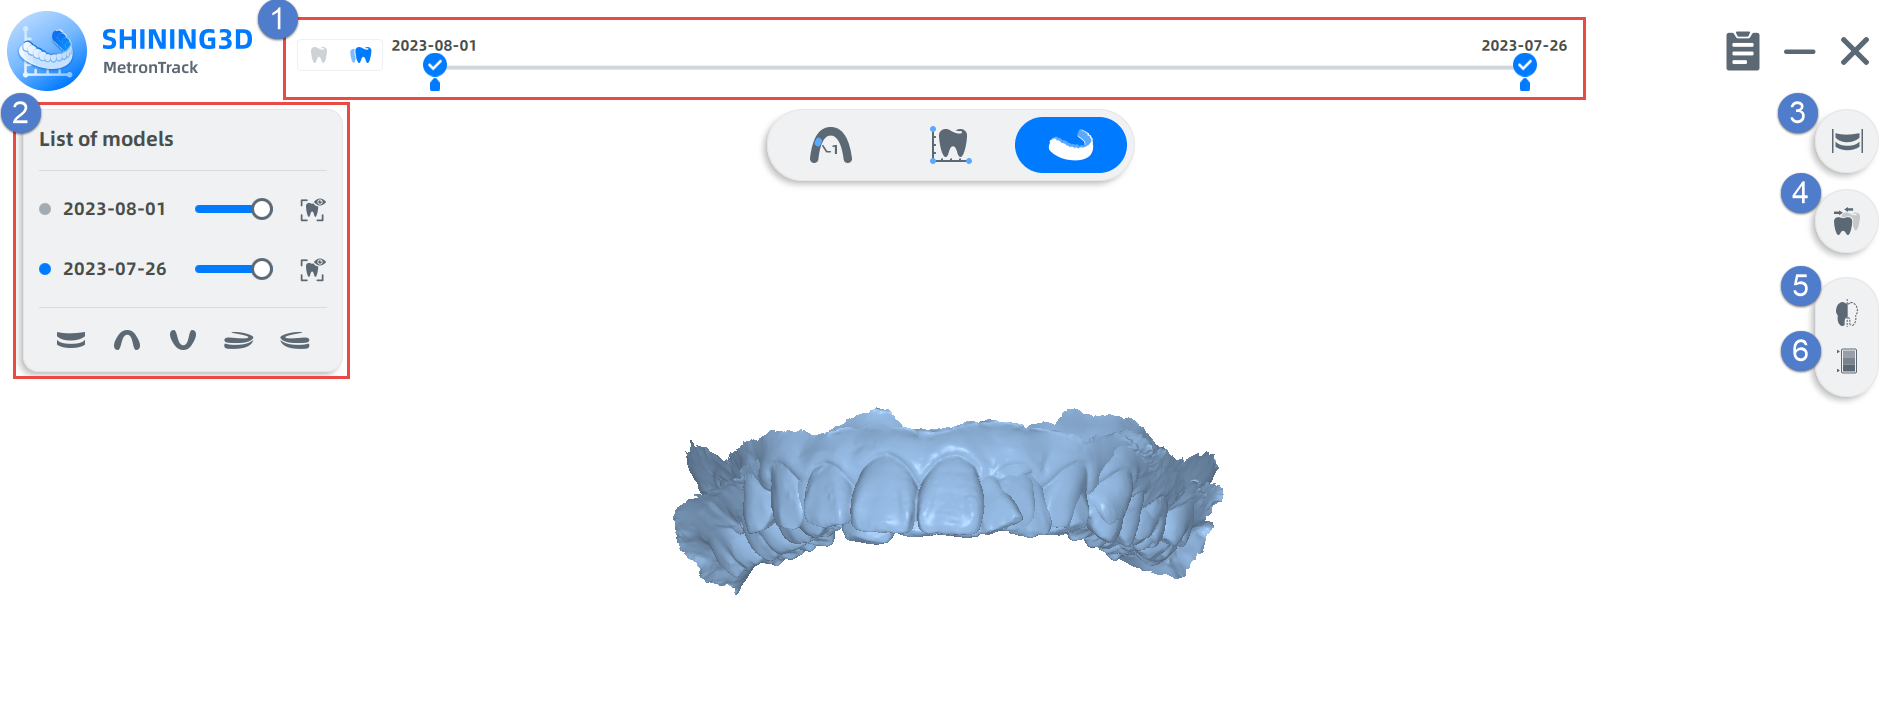
| 1 | Timeline | Display the scanned intraoral data of different time in chronological order. |
| 2 | Model List | List of intraoral data scanned at different times. Support for adjusting the transparency and texture of the model. |
| 3 | Model Alignment | Support for both automatic and manual alignment. |
| 4 | Teeth Comparison | Align and compare the teeth data of the new model with that of the old model. The results can't be modified. Detect the orthodontic effect by identifying the colors covering tooth, its adjacent teeth and opposite jaw. |
| 5 | Sectional View | View the sectional view of teeth bite and measure the distance between two points of the contour line. |
| 6 | Ribbon Chart | Visualize the data between selected teeth in different colors. |
The models from different treatment periods are aligned according to the feature points, both automatically and manually.
| Icon | Description |
|---|---|
 |
Change the viewing angle to view the jaw data. |
| Automatic alignment keys. | |
| Manual alignment keys. | |
 |
|
|
Note
In the model comparison interface, the automatically aligned total-jaw model will be displayed by default.
Auto alignment
Click to automatic alignment, and the feature points in three different colors are displayed on the model.
Manual Alignment
Click /
/
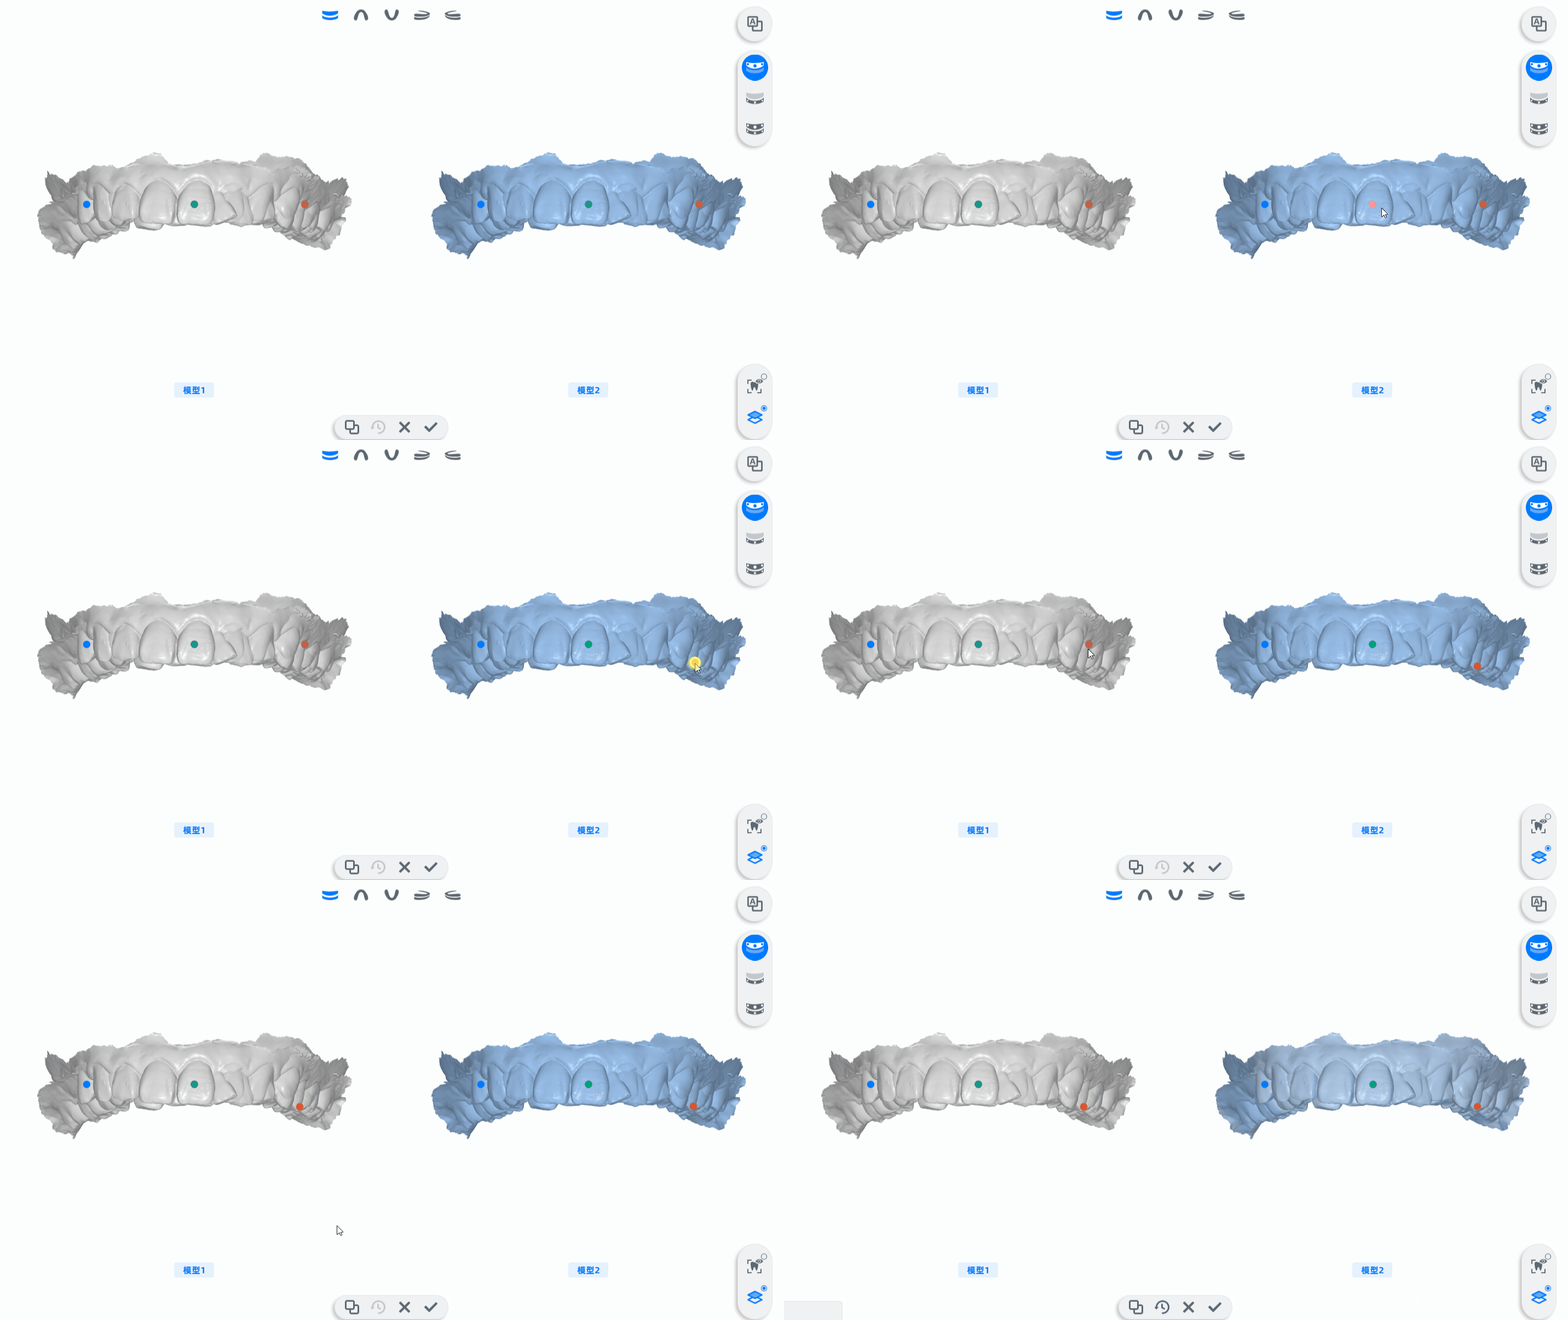
to the manual alignment interface. When the cursor is moved to the different color feature point (the feature point appears orange), press and hold the left mouse button to move the feature point, which makes the positions of the feature points on the left and right model views correspond respectively. Click
 to display alignment effect.
It refers to the comparison of teeth data between new and previous scanned teeth models after alignment.
1 Click![]() for the sectional view of teeth model.
for the sectional view of teeth model.
2 Move and rotate the section to the proper position and angle you want.
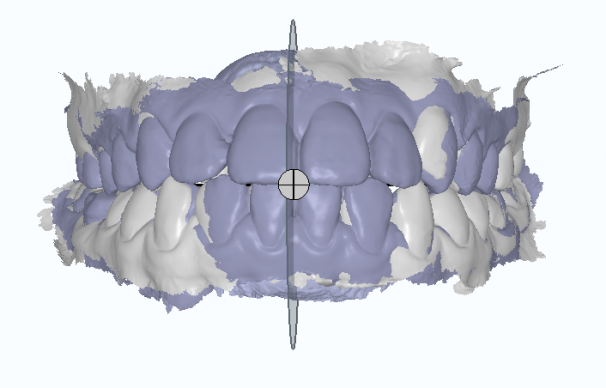
3 Comparison between new and previous scanned data is shown in the bottom-right corner. Users can click two different points to measure the distance.
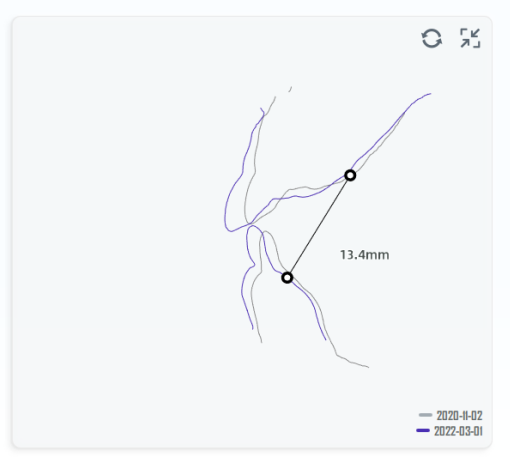
Note
● The darker lines are the newer scanned data, and the lighter lines are scanned data from earlier times.
● Compare the two lines to detect the changes of teeth movement.
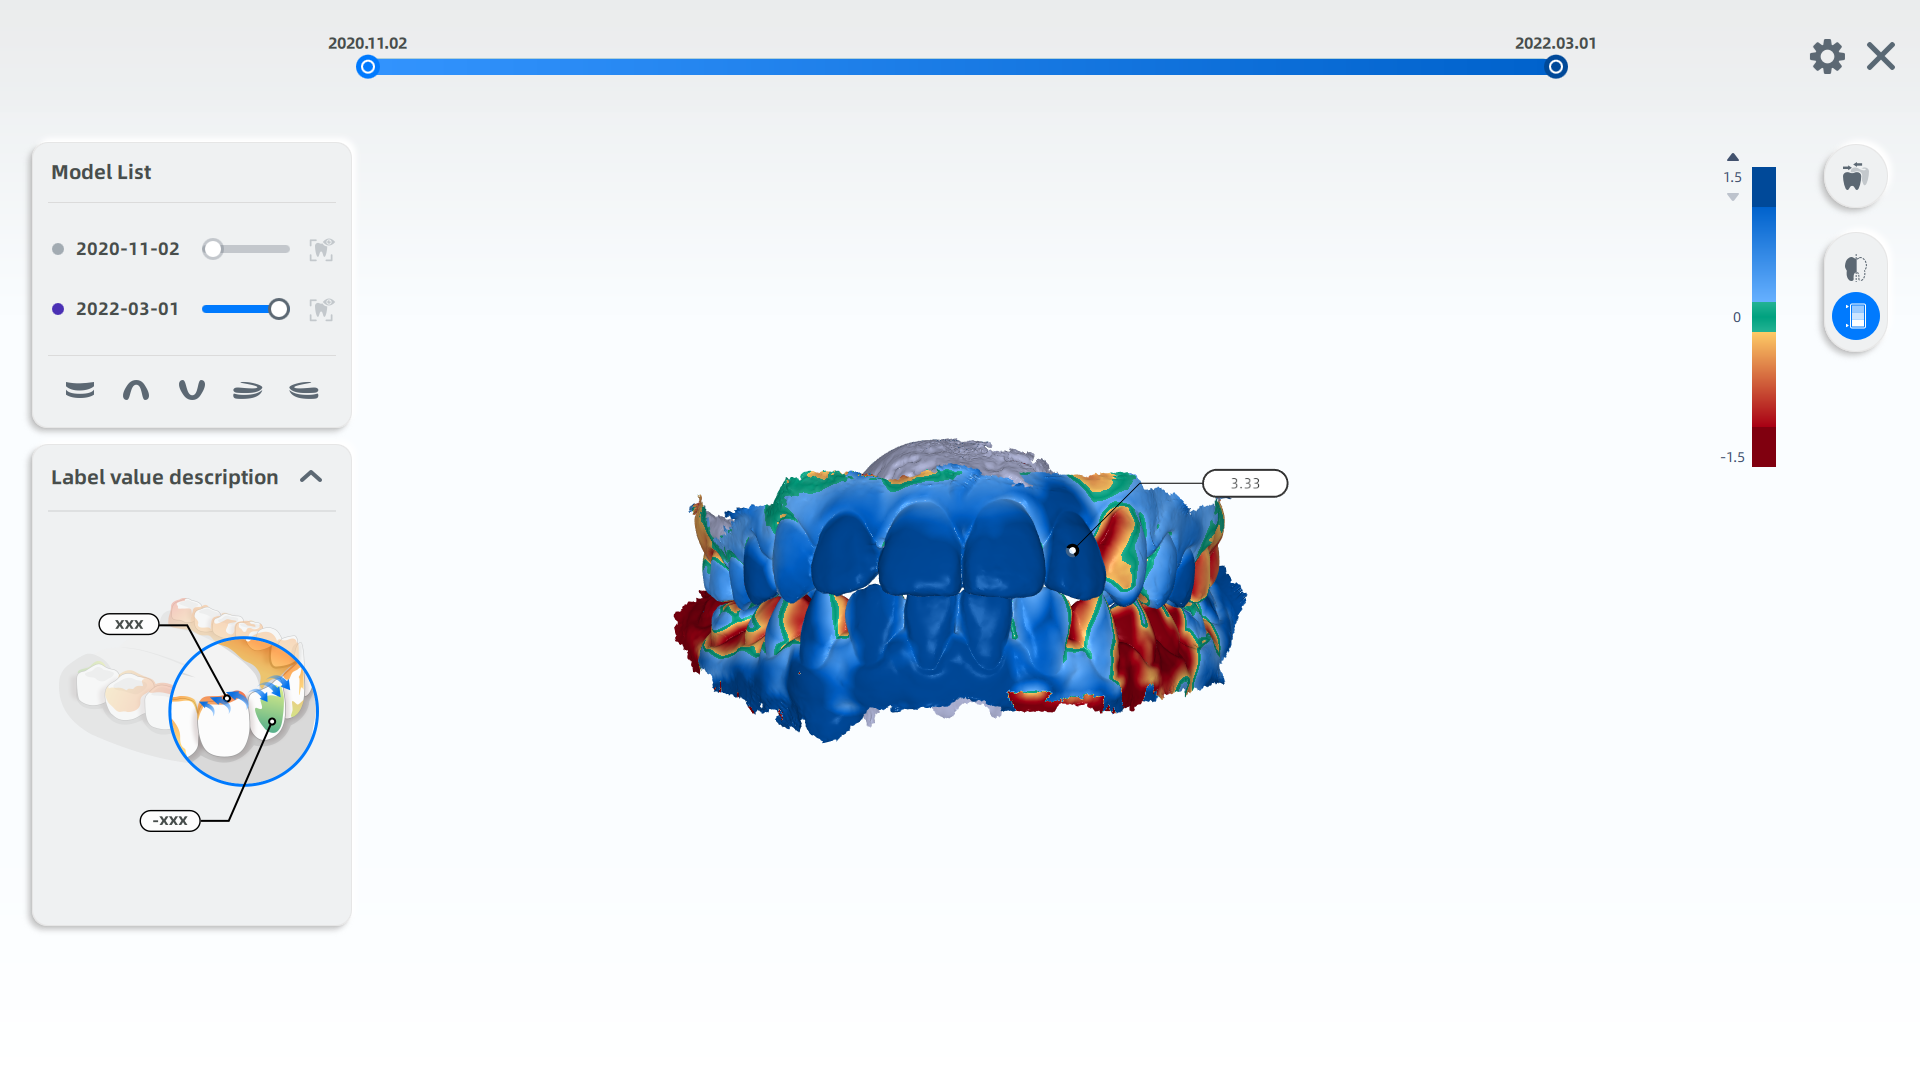
1 Click ![]() to view the ribbon chart for teeth comparison.
to view the ribbon chart for teeth comparison.
2 Move the cursor to one single tooth and its numerical value will be shown in detail.
Note
- The movement variables of the teeth in the new data are compared with the scanned data from earlier times.
- Positive values are set to blue, which indicate a shift toward cheek; Negative values are set to red, which indicate a shift toward tongue.
- The function of ribbon chart and sectional view cannot be enabled at the same time.
