Interface
Overview
Note
The screenshot shown above is for illustrative purposes only. Always refer to the actual software interface.
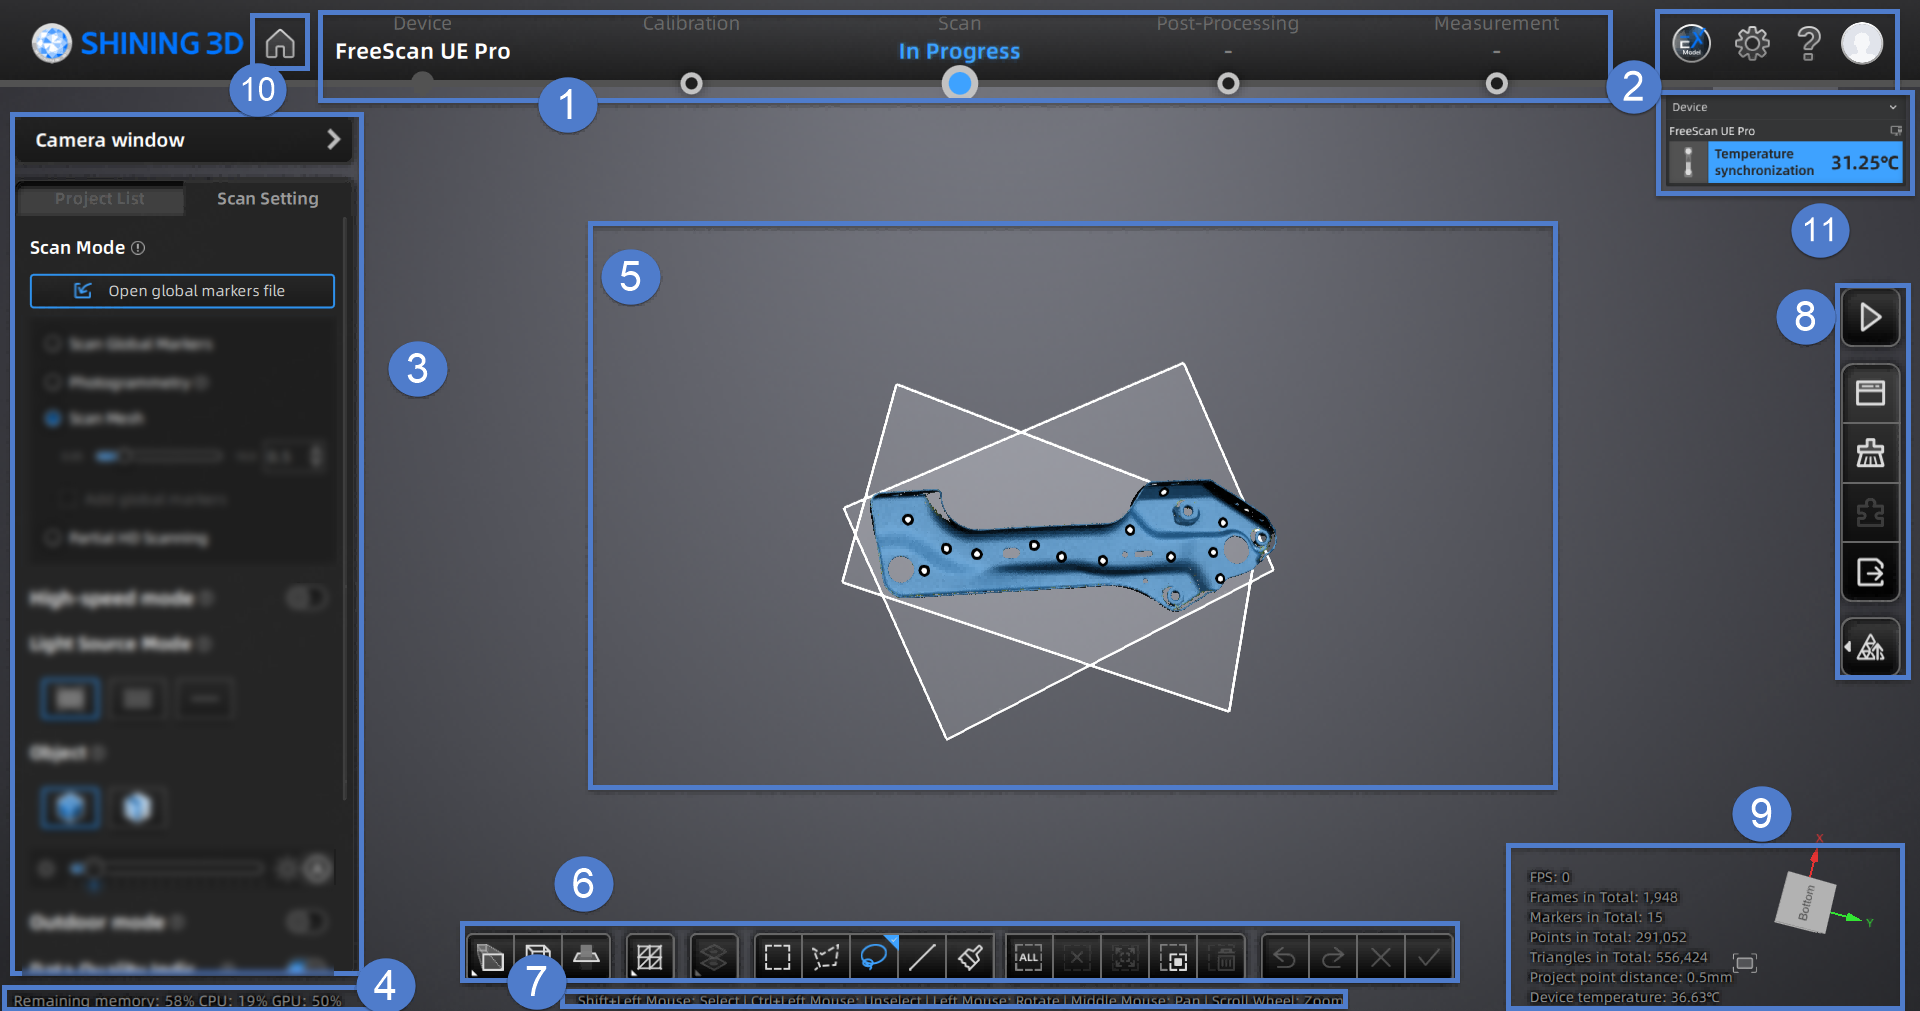
① Navigation Bar
-
Device: Display the device status as online / offline.
- Device Online: Show the device name.
- Device Offline: Click
 to reconnect the device.
-
Calibration: Click
 on the corresponding position in the navigation bar to start calibration.
 -
Scan: Click
on the corresponding position in the navigation bar to start the scanning. -
Post-Processing: Click
 /
/  after scanning, it will go to the Post-Processing interface. You can also click on the corresponding position in the navigation bar to switch to the Post-Processing interface.
 - Measurement: Click on the corresponding position in the navigation bar to switch to Measurement interface where you can measure your model here.
② Settings and Help
Click to show or hide the Device Information Card.
⑴ General
-
Warm Up: After enabling, scanner accuracy becomes more stable after warm-up. Restart the software for the setting to take effect.
-
Calibration and Scan Temperature Difference: Adjustment range 1℃ to 10℃.
-
Scanner Tone: Enabled by default. You can adjust the scanner beep volume as needed.
-
Compatible with 3Dconnexion SpaceMouse: Enabled by default. It supports 3Dconnexion SpaceMouse connection and related functions, including rotation axis and shortcuts.
-
Display Calibration Error: After enabling, the calibration completion pop-up displays the calibration error.
-
Laser Plane Calibration: Recommended when excessive noise occurs or data cannot be scanned. After enabling, perform calibration in the calibration workflow.
-
Factory Default: Click Recover to initialize all settings and restart the software automatically.
⑵ Laser Scan Settings
-
Preview: When enabled, you can preview the scanning effect before scanning.
-
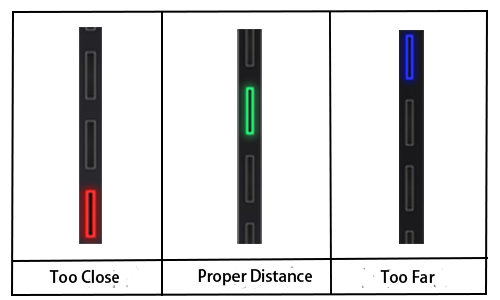
Scanning Distance Indication Method: The indication methods include laser line indication and distance bar indication. During scanning, adjust the scanning distance based on the laser line or distance bar color.
Blue indicates that the scanning distance is too far, green indicates a proper distance, and red indicates that the scanning distance is too close.
Col
 Laser Line Indicator
Col
 Scanning Distance Indicator
-
Laser Turns off Intelligently: Enabled by default. If no data is recognized during scanning, the scanner will not project laser lines.
-
Shape Detection Optimization: Before creating a project, you can enable this function. After enabling it in cross-line mode, scanning accuracy can be improved. However, this function may affect the frame rate and increase the scanned data file size.
-
Minimum Number of Marker Splices: Default is 4. Using only 3 markers may create similar triangles that can lead to incorrect alignment.
-
Large Depth of Field Mode: When enabled, increases the maximum scanning distance to 1300 mm and adjusts the optimal distance display on the distance indicator. Data cannot be captured beyond the supported range.
Caution
- This mode is unavailable when the point distance is less than 0.2 mm.
- This mode applies to cross lines and parallel lines.
-
Local Resolution Circle: Select the scanning area size in Local Resolution mode.
-
Auto-Create Clipping Plane: Use magnetic coded targets to automatically create clipping planes during scanning.
Caution
- Clipping planes created from coded targets will not disappear after the original coded targets are removed.
- Once six clipping planes exist, coded targets will no longer be recognized to create a new clipping plane.
⑶ Third-Party Software
You can check the third-party software to be called up and select the calling path. Only the selected third-party software will be displayed in the third-party software list in the Post-Processing and Measurement interfaces.
⑷ Shortcut Key
Select a mouse shortcut scheme.
| Operation | Option 1 | Option 2 | Option 3 |
|---|---|---|---|
| Select Data | Shift + Left Mouse | Ctrl + Left Mouse | Left Mouse |
| Unselect | Ctrl + Left Mouse | Shift + Ctrl + Left Mouse | Ctrl + Left Mouse |
| Rotation | Left Mouse | Left Mouse | Right Mouse |
| Offset | Middle Mouse | Middle Mouse | Left Mouse + Right Mouse |
| Zoom | Scroll Wheel | Scroll Wheel | Scroll Wheel |
⑴ About: View device name, serial number, calibration board, software version information, etc. After checking Download Updates Automatically, when a new software version is detected, it will be automatically downloaded and prompt you to install it. Otherwise, you need to manually download and update the software.
⑵ System Diagnose: Diagnose the software operating environment and check whether your computer configuration meets the running requirements. If ![]() appears, the device information is read correctly or the configuration meets the requirements. If an exception is displayed, follow the on-screen prompts to check the device connection and computer configuration, then click Refresh to diagnose again.
appears, the device information is read correctly or the configuration meets the requirements. If an exception is displayed, follow the on-screen prompts to check the device connection and computer configuration, then click Refresh to diagnose again.
⑶ Support: Open the user manual, request remote assistance, or contact technical support.
Note
Col
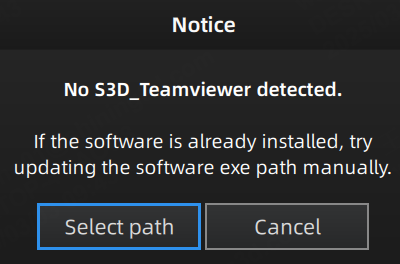
If the software displays a pop-up stating "No S3D_TeamViewer detected" when you use remote assistance, click Select Path in the dialog box and choose TeamViewer's .exe file to manually update the launch path for TeamViewer.
Col
- Account: View login status, account information, and authorization period.
- My SHINING 3D Account: Click to enter the personal center.
- Official Website: Click to visit our official website for more products and information.
- Facebook: Enter our Facebook to view product introduction and learn other operations.
- Logout: Some software functions are unavailable after logout. Click Login to log in again.
③ Scanning Settings
-
Camera Windows: To preview the actual scene during scanning. Parameters can be adjusted accurately through the camera window.
-
Project List: To manage projects and the project group. For more, see Project and Project Group.
- Scan Setting: To set scanning parameters. For more, see Settings.
④ Memory / CPU / GPU
- Remaining Memory: To display the percentage of remaining memory.
- CPU Usage: To display the CPU Usage of the computer in real time. You may need to close other unrelated software if it is too high.
- GPU Usage: To display the GPU Usage of the computer in real time.
⑤ Preview / Scanning Window
To preview the model and check the scanned model.
⑥ Edit Toolbar
To edit data after scanning. See more details in Data Editing.
⑦ Shortcuts
To change the perspectives and move the model by the composition of keys.
⑧ Side Toolbar
For more, see Scanning and Other Functions.
⑨ Other Information
To show information about FPS, Frames in Total, Points in Total, etc.
| Function | |
|---|---|
Fit View |
Click |
View Controller |
⑩ Home Page
Click ![]() to quickly return to the home page.
to quickly return to the home page.
⑪ Device Information Card
View device connection status and other related information. If the device connection is successful, the device will be displayed in green on the device card; if the device is warming up, it will be displayed in orange; if the device is not connected, it will be displayed in gray.
Note
Please wait for the device warm-up to complete, i.e., when Ready status is displayed on the device information card, before starting calibration or scanning.