Create Oral Health Monitoring Reports
The Dental Cloud supports to create and edit the oral health monitoring reports, which help doctors and patients visualize dental diseases for better analysis.
Create a report
You can start creating an oral health monitoring report in two ways:
-
Method 1:
- In Cases, select an order whose case source is Aoralscan.
- In the top-right corner of the preview page, click Oral Health Monitoring to enter the report settings window.
-
Method 2:
- In Patient Management, click a patient's name to navigate to the patient details page.
- Click Oral Health Monitoring in the bottom-right corner, then select data (up to 4 sets of intraoral scan models) on the right panel as needed.
- Click Confirm at the top to enter the report settings window.
Note
- Oral health monitoring reports are only available for orders sourced from intraoral scanners.
- It requires authorization. If you do not have authorization, please contact technical support.
- The selected data must include both the upper and lower jaws. The model with the most recent visit date will be used as the primary model.
Report settings
After creating a report, the Health Monitoring Report Settings window will open, where you can configure the report target (adult or child), symptoms template, tooth notation method (FDI World Dental Federation notation or Universal Numbering System), and monitoring type.
Once all settings are configured, click Start.
Note
Different targets correspond to different dental disease templates. Three default templates are provided, and you can customize them under  Institution > Dental Disease Templates.
Edit the report
When creating a report, symptoms can only be added to intraoral models.
-
Screenshot: When enabled, a black dashed screenshot frame will appear on the model.
- Move the screenshot frame over the symptom area on the model.
- Based on the actual situation, select the problem tooth and problem type, and add notes as needed.
- Click
 to add the symptom.
The added symptom will be displayed in the Symptoms panel on the right.
Note
- Drag the edge of the screenshot frame to move it; drag the corners to enlarge or shrink the frame.
- When multiple models are imported, the screenshot function is only available when the primary model (the one from the most recent visit) is selected individually.
-
Magnifier: When enabled, a magnifying glass will appear at the cursor position. Move it over the model to zoom in for better detail observation.
- Paintbrush: When enabled, hold down the left mouse button to draw annotations on the model. Annotations will disappear after 5 seconds.
-
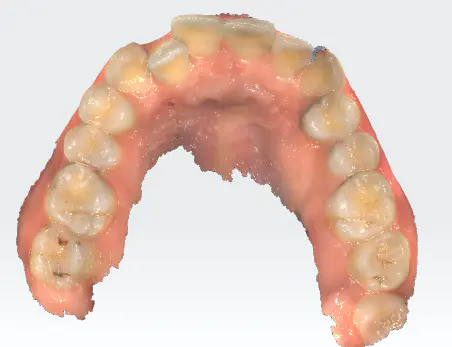
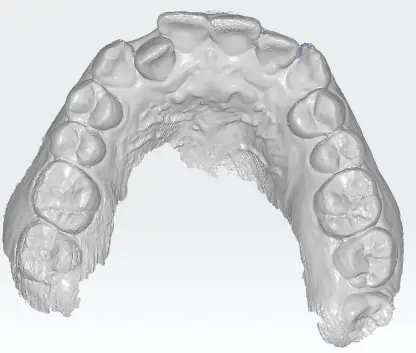
Texture:
Col
Col
-
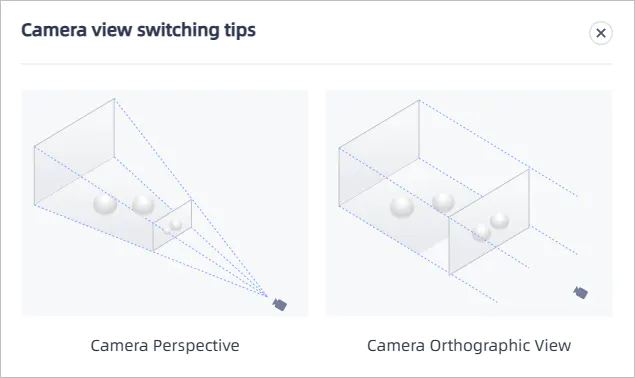
Orthogonal: Toggle between orthographic projection and perspective projection.
-
Reset: Click to reset the model to its initial state.
-
Model Comparison: If multiple groups of data have been added, you can drag
 on the timeline at the top to switch between models, or click a node to select two groups for comparison.
When comparing models, you can choose split-screen comparison or overlay comparison.
- Split-screen mode: The two models are displayed side by side in left and right views.
- Overlay mode: The two models are automatically overlaid. You can switch between different models on the same screen using a slider. The model displayed on the left side of the slider is the one positioned to the left on the timeline, and the one on the right corresponds to the right side of the timeline.
Note
If you need to replace, add, or remove models, click Add Model in the top-right corner and select in the pop-up window. The primary model (model from the most recent visit) cannot be replaced.
Oral diagnosis
Four major categories: Dental Health, Periodontal Health, Occlusal Analysis, and Dental Arch Morphology.
Tooth health
Dental caries
After entering the caries analysis, caries areas in texture data and near-infrared data will be automatically identified and marked on the model in different colors, aiding in the diagnosis of coronal caries.
Note
Near-infrared lesions need to be uploaded separately.
Show/Hide and Opacity: Click  to hide marked areas, or drag the slider to adjust the opacity of marked areas.
Tooth wear
After entering the tooth wear analysis, tooth wear areas will be automatically identified and marked on the model.
Periodontal Health
Plaque
After entering the plaque analysis, plaque areas will be automatically identified and marked on the model in different colors.
Gingival recession
After entering the gingival recession analysis, areas of gingival recession will be automatically identified. The degree of recession is classified into 3 types: severe, moderate, and mild, which will be marked on the model in different colors.
- Click to hide the markings for that degree of recession on the model.
- Hover the mouse over a marked area on the model to display the recession data for that area.
Note
The classification criteria for recession can be manually adjusted. Click  to adjust in the pop-up window, then click Confirm to apply the new criteria.
Occlusal analysis
Occlusal indicator wax
Occlusion depth can be viewed through color indicators and specific values, helping to quickly and intuitively determine which teeth have occlusal issues.
-
Color Indicator: Displays occlusion depth on the model in different colors, with a color bar chart in the bottom-left corner showing the display range. Click the arrows on the color bar chart to adjust the occlusion display range.
- Green indicates the disclusion area between jaws.
- Red indicates the collision area between jaws.
- Blue indicates the penetration area between jaws.
-
Specific Values: Move the cursor over a colored area on the model to display the occlusion depth at that point. Click to add a label for that point.
Cover
Cover measurement helps you examine the occlusal relationship between the patient's upper and lower teeth, aiding in the diagnosis of occlusal issues.
After entering it, the system will automatically detect the upper and lower teeth that have an overjet/overbite relationship, add crown boundary lines at 1/3, 1/2, 2/3 of the upper and lower crowns, and generate feature points. A measurement table will also be generated, including tooth position, overjet, and overbite data.
Note
The overjet and overbite measurement results can be manually modified. Modified values will be displayed in blue.
Dental arch analysis
Includes crowding severity, Bolton ratio, and dental arch shape.
Note
If the analysis data is inaccurate, click the prompt below the measurement table to perform model measurement for more accurate results.
Crowding severity
Crowding severity is an important indicator for determining whether a patient needs tooth extraction. The crowding measurement function is mainly used to measure dental arch crowding. This function measures the sum of crown widths and the fitted dental arch curve length; the difference between the two is the crowding.
After entering it, the system will automatically generate fitted dental arch curves for the upper and lower jaws, along with a measurement table that includes bone mass, tooth mass, and crowding data for both jaws.
Note
The crowding severity measurement results can be manually modified. Modified values will be displayed in blue.
Bolton ratio
The Bolton index refers to the proportional relationship between the mesiodistal widths of the upper and lower teeth. Through Bolton ratio measurement, you can preliminarily determine whether the patient's upper and lower dental arches and tooth widths are abnormal, serving as a reference for diagnosing malocclusion.
Furthermore, the Bolton ratio measurement values allow you to analyze the tooth size of the upper and lower jaws and effectively adjust tooth alignment based on the values. Therefore, the Bolton ratio has significant reference value when designing orthodontic treatment plans.
After entering the Bolton ratio measurement function, the widths of the upper and lower teeth will be detected and displayed on the model with green dashed lines, and a measurement table will be generated, including the anterior ratio and overall ratio.
Note
The Bolton ratio measurement function is only applicable to the permanent dentition.
Arch Shape
Dental arch shapes are generally classified into three types: square, ovoid, and tapered. After entering the arch shape function, the arch forms of the upper and lower jaws will be automatically detected and a measurement table will be generated. Manual modification of the upper and lower arch shapes is also supported.