Compare
Click Compare in the top navigation bar to enter the comparison module, where you can perform ![]() 3D compare,
3D compare, ![]() 3D local compare,
3D local compare, ![]() 2D compare and
2D compare and ![]() comparison, i.e., using the color map to display the deviation between the measured model and the reference model. Additionally, you can also create annotation point deviations on the color map.
comparison, i.e., using the color map to display the deviation between the measured model and the reference model. Additionally, you can also create annotation point deviations on the color map.
Note
- After generating a comparison object, you can edit point annotations again through the right-click menu in the left-side tree view.
- Before using the compare function, please import the reference model and measured model, and perform alignment operations.
- After creating a comparison object, you can view the proportion of points within tolerance and points exceeding tolerance in the right Properties panel.
- You can export deviations through the right-click menu of the corresponding comparison item in the tree view after completing the 3D compare, 3D local compare or comparison point.
- If multiple different types of comparison objects have been generated, you can click to switch in the left tree view, and they can be displayed simultaneously in the 3D scene, but only the ribbon associated with the selected comparison object will be displayed.
3D Compare
- In the Compare Tools bar, click
 3D Compare to open the corresponding window.
 -
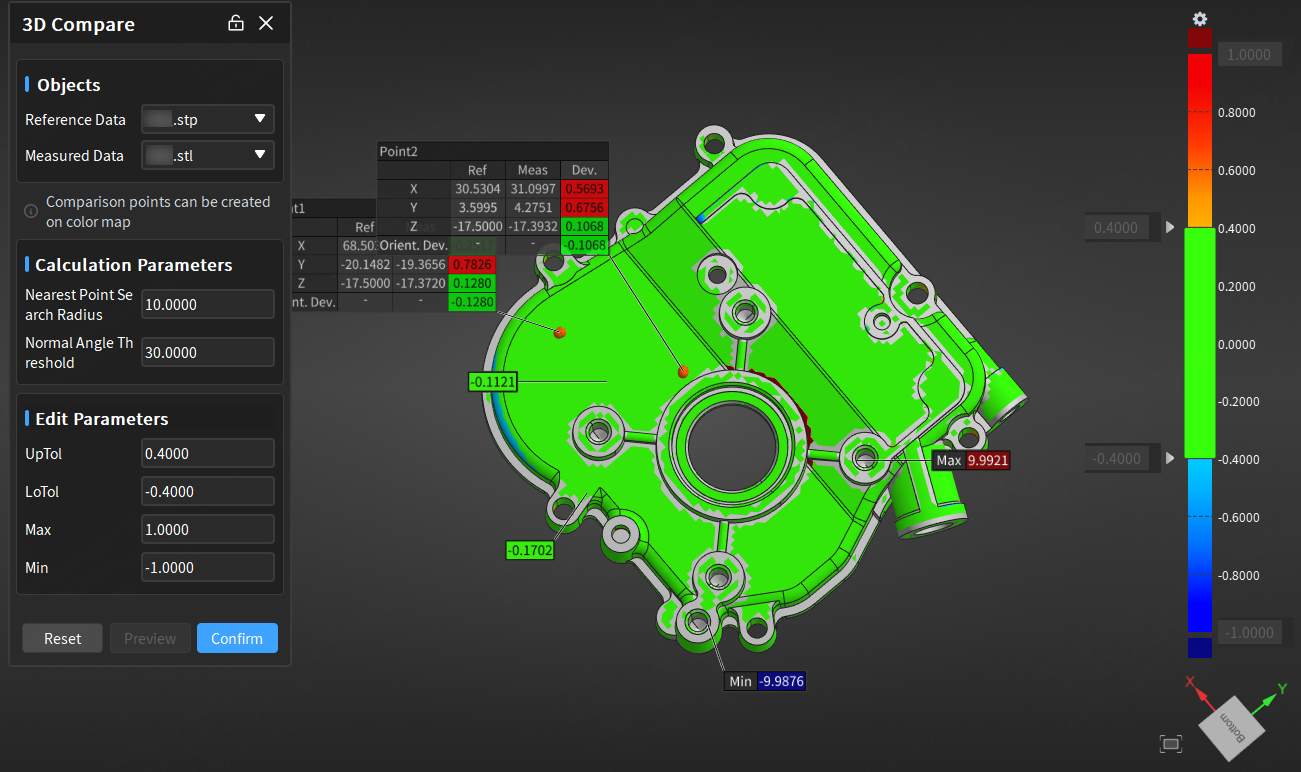
Select the reference and measured models to be compared, and edit parameters (upper & lower tolerance and maximum & minimum values) in the right ribbon and select a ribbon template.
Note
- The tolerance range should be smaller than the difference between the maximum and minimum values, otherwise it will not take effect.
- Additionally, if the absolute values of the upper tolerance and lower tolerance are the same, adjusting the upper tolerance will cause the lower tolerance to change synchronously; if the absolute values of the maximum and minimum values are the same, adjusting the maximum value will cause the minimum value to change synchronously.
-
Click Preview to display the 3D color map in the scene and the ribbon in the right; then click Confirm to save the 3D compare object, which will be displayed in the
 compare module in the left-side tree view.
Note
- As the 3D compare object is associated with the aligned object, the 3D compare object can only be checked when the associated aligned object is activated.
- Multiple 3D compare objects can be created for one aligned object, and each 3D compare object has one individual ribbon.
-
(Optional) In the preview state, you can click on the 3D color map in the scene to create comparison points, or right-click on one 3D compare object in the tree view, click Edit Compare Points, and click on the 3D color map to create; for the created comparison points, you can use left-button to drag or use Del to delete.
Note
The created comparison points can only be deleted in the preview state.
3D Local Compare
- In the Compare Tools bar, click
 3D Local Compare to open the corresponding window.
 -
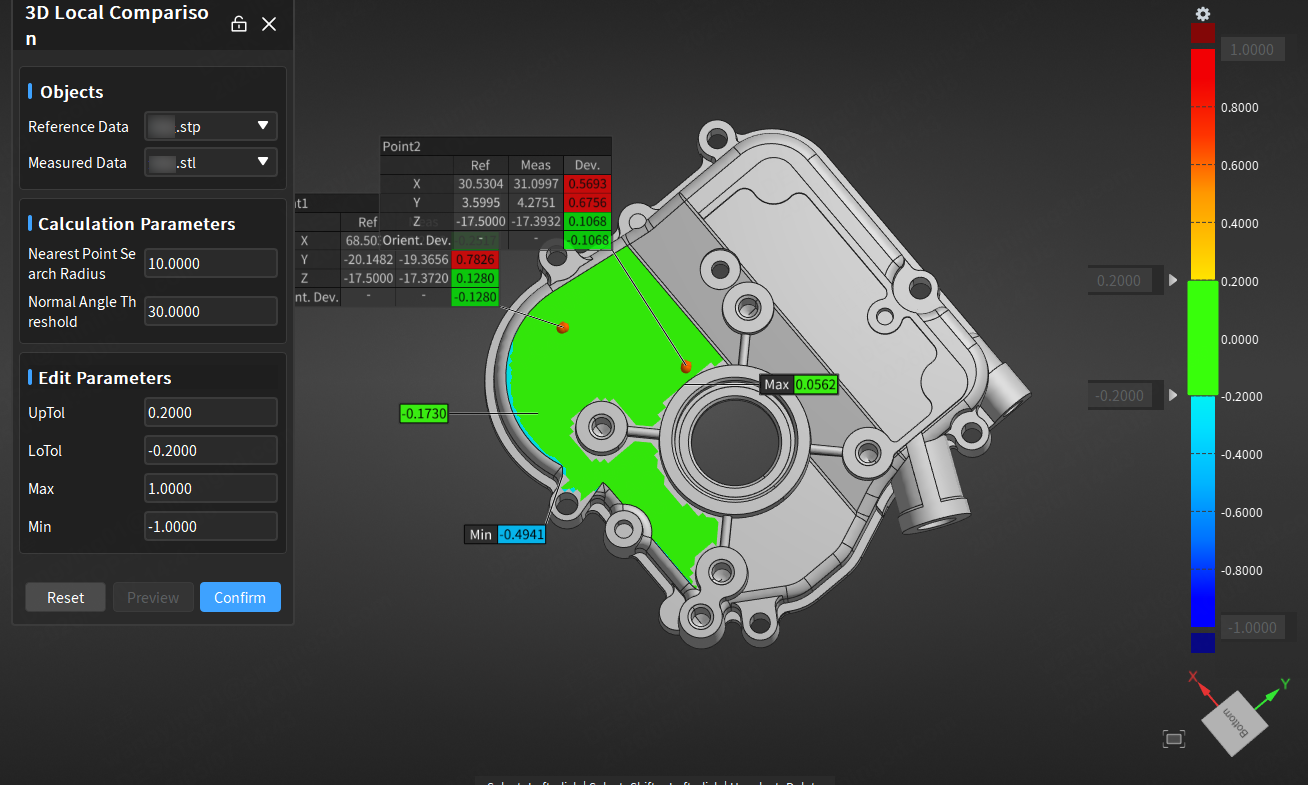
Select the reference & measured models and alignment object, and click on the model to select one or multiple faces.
Note
- Use Shift and left-click to select an area.
- Use Del to cancel selected faces.
-
Edit parameters in the 3D Local Compare window, and edit parameters (upper & lower tolerance and maximum & minimum values) in the right ribbon and select a ribbon template.
Note
- The tolerance range should be smaller than the difference between the maximum and minimum values, otherwise it will not take effect.
- Additionally, if the absolute values of the upper tolerance and lower tolerance are the same, adjusting the upper tolerance will cause the lower tolerance to change synchronously; if the absolute values of the maximum and minimum values are the same, adjusting the maximum value will cause the minimum value to change synchronously.
-
Click Preview to display the 3D color map of the selected planes in the scene and the ribbon in the right; then click Confirm to save the 3D compare object, which will be displayed in the
compare module in the left-side tree view.Note
- As the 3D compare object is associated with the aligned object, the 3D compare object can only be checked when the associated aligned object is activated.
- Multiple 3D compare objects can be created for one aligned object, and each 3D compare object has one individual ribbon.
-
(Optional) In the preview state, you can click on the 3D color map of the selected planes in the scene to create comparison points, or right-click on one 3D compare object in the tree view, click Edit Compare Points, and click on the 3D color map to create; for the created comparison points, you can use left-button to drag or use Del to delete.
Note
- Compare points can not be created outside of the color map area.
- The created comparison points can only be deleted in the preview state.
2D Compare
- In the Compare Tools bar, click
 2D Compare to open the corresponding window.
 -
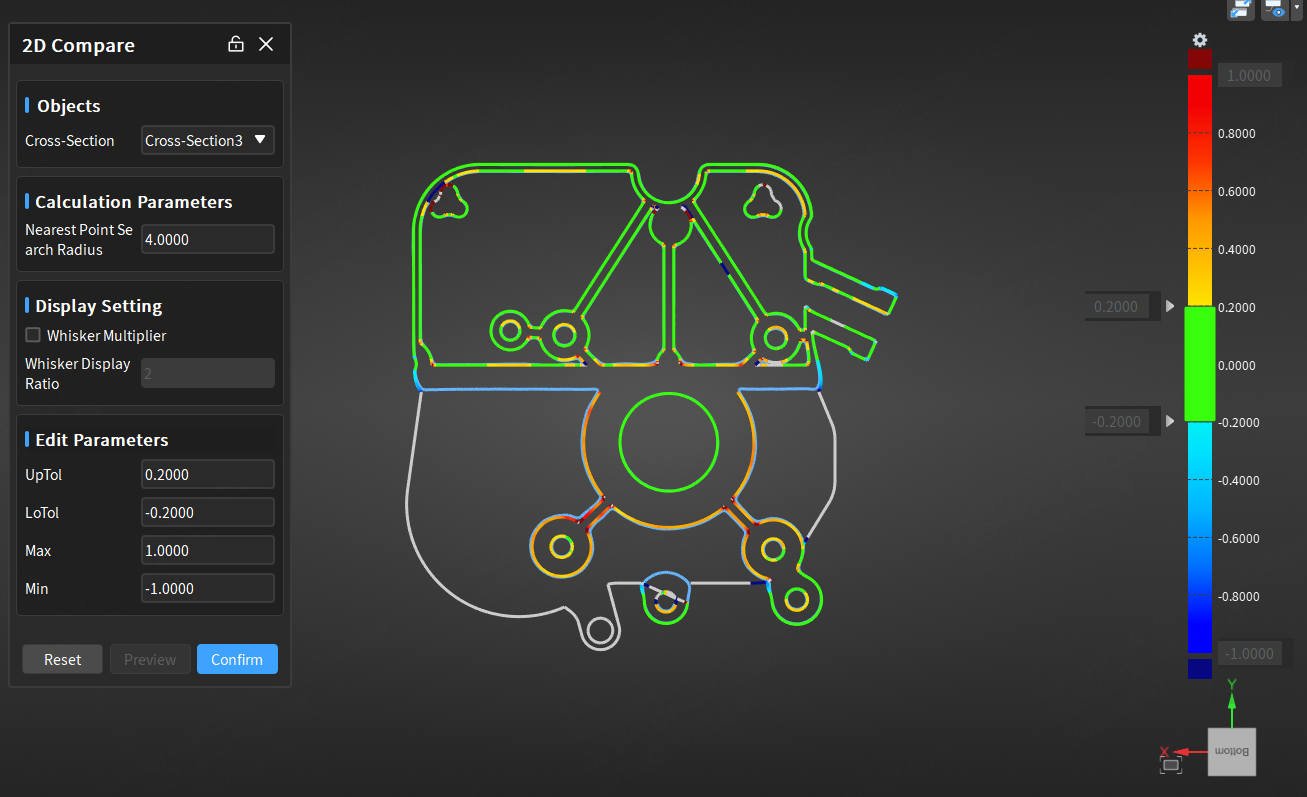
Select the cross-section pair to be compared, and edit parameters (upper & lower tolerance and maximum & minimum values) in the right ribbon, select a ribbon template, and customize display settings, including line segment deviation and display multiplier (value range is 1 < x ≤ 1000, default value is 2).
Note
- Only the cross-section pair including both the reference cross-section and the measured cross-section can be selected.
- The tolerance range should be smaller than the difference between the maximum and minimum values, otherwise it will not take effect.
- Additionally, if the absolute values of the upper tolerance and lower tolerance are the same, adjusting the upper tolerance will cause the lower tolerance to change synchronously; if the absolute values of the maximum and minimum values are the same, adjusting the maximum value will cause the minimum value to change synchronously.
-
Click Preview to display the 2D cross-section color map in the scene and the ribbon in the right; then click Confirm to save the 3D compare object, which will be displayed in the
compare module in the left-side tree view.Note
- As the compare object is associated with the aligned object, the 3D compare object can only be checked when the associated aligned object is activated.
- Multiple compare objects can be created for one aligned object, and each 3D compare object has one individual ribbon.
-
(Optional) In the preview state, you can click on the 2D cross-section color map in the scene to create comparison points, or right-click on one 2D compare object in the tree view, click Edit Compare Points, and click on the 2D cross-section color map to create; for the created comparison points, you can use left-button to drag or use Del to delete.
Note
The create comparison points can only be deleted in the preview state.
Surface Compare Points
Parameter Description
-
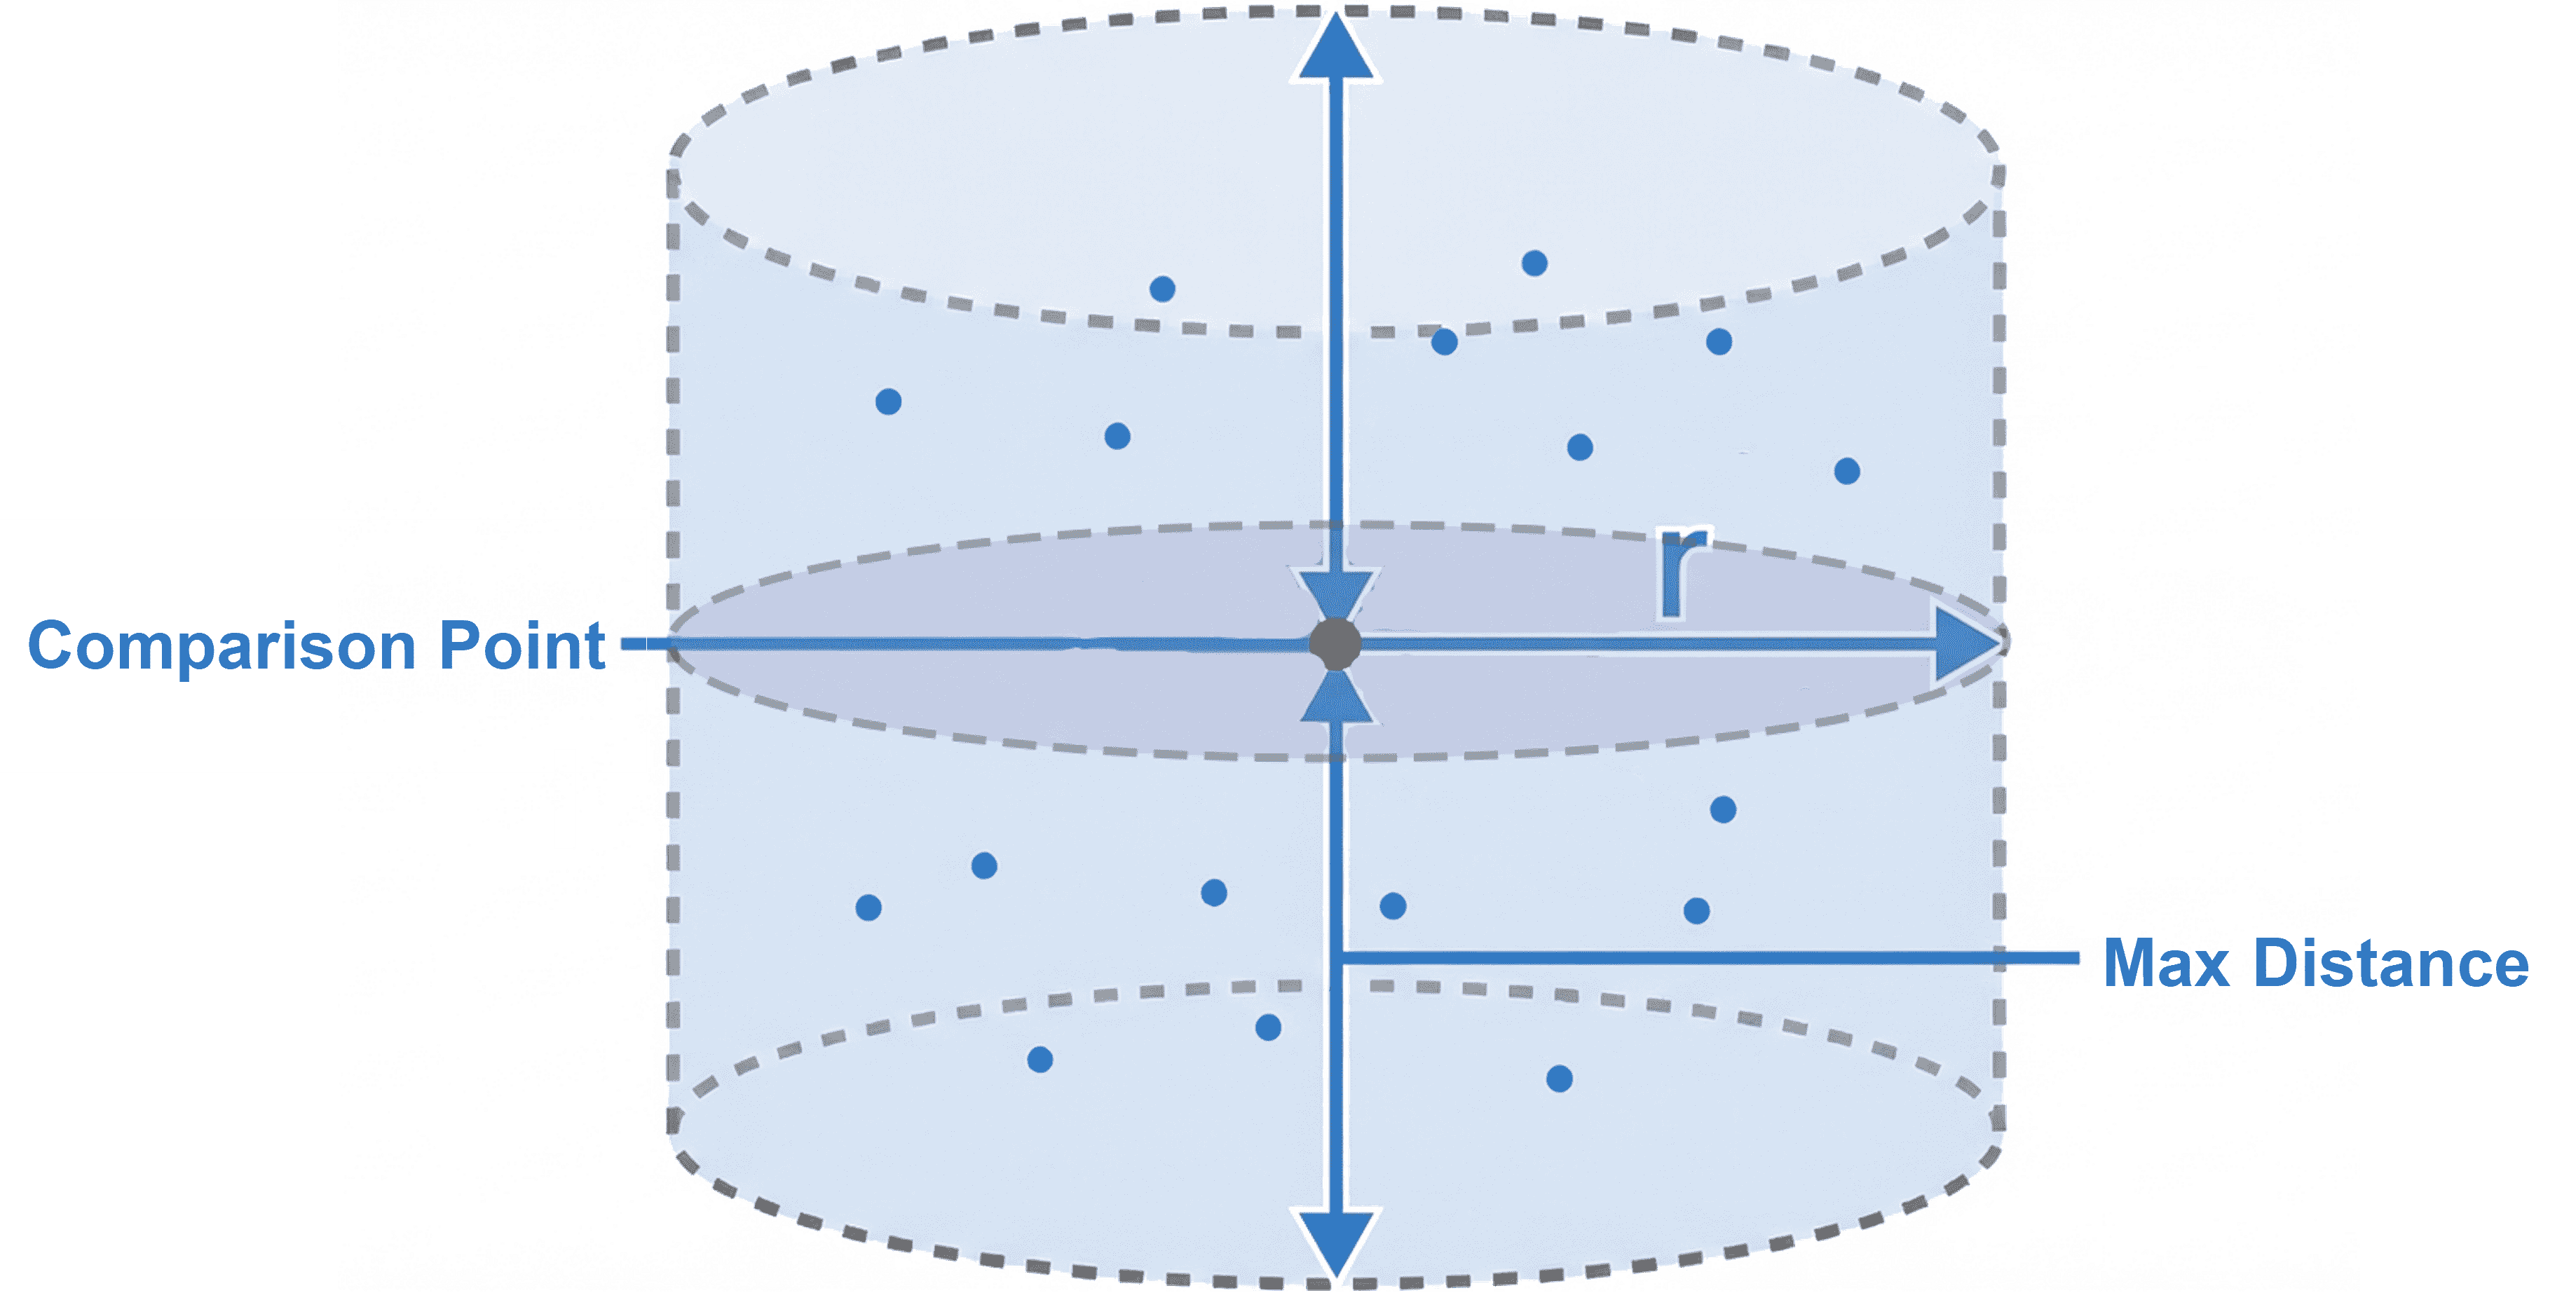
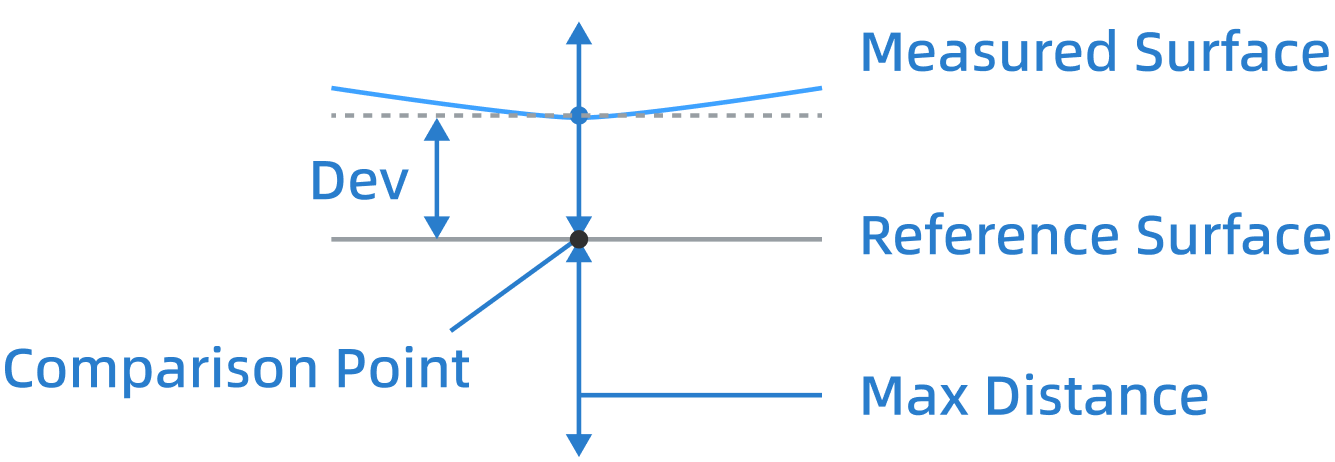
When the measurement data consists of point clouds, a cylinder is constructed to obtain the point set, with the cylinder centered on the comparison point, the axis aligned with the axis of the comparison point, and the length equal to twice the max distance. The point set within the cylinder is identified, and points that do not meet the criteria are filtered out based on the maximum angle. The weighted average of the remaining points to the disk is calculated, which represents the deviation of the surface point distance.
-
When the measurement data consists of mesh, a line segment is constructed to obtain the intersection points with the mesh, centered on the comparison point and aligned with the normal vector of the comparison point, and the length is twice the max distance. The deviation of the surface point distance is the distance between the intersection point and the comparison point.
Operation Steps
- In the Compare Tools bar, click
 Surface Comparison Points (Anchor, Grid Sampling, or Point Feature Group) to open the corresponding window.
 - Select the reference and measured models to be compared, edit parameters, and select a ribbon template.
-
For the Anchor method, click on the reference model to create comparison points; for Grid Sampling and Point Feature Group methods, set the parameters and click Apply to create comparison points; after creation, the software will automatically calculate the surface distance deviation between the two comparison points, display labels in the 3D scene of the model based on the tolerance, and display the ribbon on the right.
Parameters Value Range Spacing (Grid Sampling) (0.1,10000】 Array Angle (Grid Sampling) 0° ~ 360° Radius (0.1,100】 Max Distance (0, 1000】 Note
- If creation fails, labels will still be displayed, but the deviation values are invalid.
- Upper & lower tolerance range must be smaller than the difference between maximum & minimum values, otherwise it will not take effect.
- When the measurement model is a mesh, there is no radius parameter setting; when the measurement model is a point cloud, the radius can be set.
- If the absolute values of upper and lower tolerance are the same, when adjusting the upper tolerance, the lower tolerance will change synchronously; if the absolute values of maximum and minimum values are the same, when adjusting the maximum value, the minimum value will change synchronously.
- In Grid Sampling, you can use Shift and left-click to select an area by dragging.
- In Grid Sampling, you can use Ctrl and left-click to select multiple areas simultaneously.
-
Click Confirm to save the compare object, and the corresponding
comparison point group will be displayed in the compare module in the left-side tree view.Note
- As the compare object is associated with the aligned object, the 3D compare object can only be checked when the associated aligned object is activated.
- Multiple compare objects can be created for one aligned object, and each 3D compare object has one individual ribbon.
Ribbon
On the right-side ribbon, you can enter values by left-click on the input box or use ![]() stepper, so as to adjust the tolerance range and the maximum & minimum values; you can also drag
stepper, so as to adjust the tolerance range and the maximum & minimum values; you can also drag ![]() up and down to adjust the tolerance range.
up and down to adjust the tolerance range.
When adjusting values, the parameter values in the setting window and the color map in the 3D scene will be updated in real time.
Note
When the comparison settings window is open, you can only adjust the tolerance range and maximum & minimum values in the window.
Ribbon Settings
In the ribbon on the right side of the interface, click ![]() to open ribbon settings, set ribbon template, tolerance band, ribbon gradient, out-of-range color, and ribbon mode.
to open ribbon settings, set ribbon template, tolerance band, ribbon gradient, out-of-range color, and ribbon mode.
Ribbon Template
By default, the software's built-in template (default.snicol) is used. You can modify the default template to customize your own ribbon template.
Note
The default template is located in the 'C:\Users\Public\Shining3d\Inspect\config\BasicApp\colorbar' folder. If you have custom templates, please store them in this folder.